2020-2022
Recap
A bullet point summary and some self-constructive criticism adequately captures 2020-2022:
Had a short break for COVID
Cracklins didn’t deliver
Not enough sleep
Lazy on the graphs?
Best year ever?!
The math doesn’t completely add up, but some how we pulled off the best year ever. Lessons learned from previous years paid dividends, and my note taking was better than ever. That said, as always there is a lot to learn from. Not only that, but ‘23 is a little bit of a lucky number, so I am thinking this year will top the charts!
Read on to hear about what happened in 2022 and how we will improve next year!
Graph Time
I wouldn’t be offended if someone comes up to me and says “Hey — you really dropped the ball on the graph this year”. While collecting the data I knew I was being lazy. In putting together these plots, I have flash backs to piano recitals at age 10, where I stumble through Mozart’s [insert beautiful jingle], simultaneously living the embarrassment of the current moment while reliving the laziness of every half-assed practice that got me there. There’s an old saying in algorithm development (at least as old as algorithm development itself): “Garbage in, Garbage out”. About 40 data points is barely enough to do anything useful except motivate a better solution next year. OK - enough negativity. On the bright side, I made the graph neon!
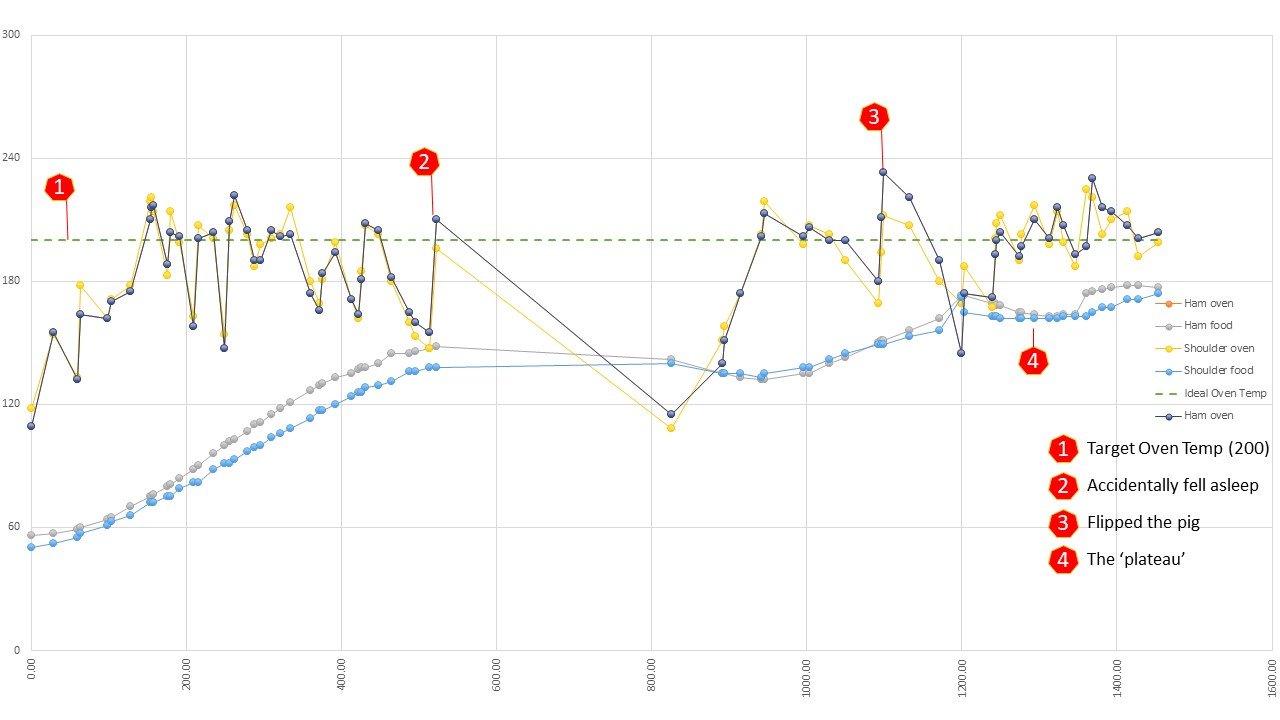
Lets break it down (match the numbers up to the graph):
I started the fire at 12:00. I thought this was useful information to record, but come graph time, it didn’t lend much to putting neon lights on the board because I did not actually record any temperatures. Thankfully, its 2022 and I can just google the temperature in any location, date and time. I therefore plotted the starting temperature of the oven at 77F (= 25C) and the food at 40F.
I started shoveling coals into the oven at 14:23, recording the temp as it climbed toward the target temp…
200C is target temperature for the oven to sit for the duration of the cook.
The pig went into the smoker at 17:49. This is where I failed to maintain any sort of meaningful system for tracking the temperature…
To assist with explaining this, I have plotted a new variable named ‘Coherence’, which uses a complicated score and algorithm to track my ability to make good decisions throughout the course of the cook. You’ll notice a sharp dip as the pig went into the oven at No.5 - where I decided to forgo any system for establishing when to take temperature measurements: before or after adding coals. As a result, for the next ~12 hours I have sporadic readings for the temperature of the oven, with no real indication on how to better control it. This is where I start to think of the dominos tracker, and have determined next year will indeed be better..
Compared to previous years, the train was well ahead of schedule. And by train, I mean the pig, and by schedule I mean...well actually, the schedule. Around 4:30 AM, I figured it was safe to take a nap because the pig was already well into the plateau (see 2019 and other years). You’ll notice my decision making ability on the ‘Coherence’ line barely decreased for about 2 hours while I slept. In reality, being ahead of schedule isn’t much better than being late. By 6AM I was freaking out about being ready too far ahead of time!
At 9:20AM, we flipped the pig.
From here - it was smooth sailing. It took a while to re-heat the oven, but the temperature continued to climb. The probe on the ‘Ham Oven’ did break, so I did lose some readings there. At 4PM we went into a holding pattern, as we had reached temperature. 2 Hours ahead of schedule!
2022 Pig roast graph. Temperatures were recorded for both the food and the oven at the shoulder and ham regions. Timing intervals were sporadic and totally arbitrary. Horizontal axis is time of day and vertical axis is temperature in F.
Lessons Learned
Take a look at the last few graphs…
Pathetic
Improvement
Interesting
Neon!
Lets start with the most important things:
The graphs are getting better, but with obvious drawbacks. The ‘Coherence’ curve being a true representation of my state of mind, I was barely able to speak by the end of it (I apologize for any of my conversations). It seems the obvious next step is to source or make a thermocouple connected to an Arduino of sorts to log temperatures in real time - ideally posting to a webserver so that we track the cook progress live. I thought about overlaying all these plots on the same graph, but figured my time would be better spend toward this completely original idea… Check out my progress here: Link.
When is the best time to flip the pig? I have a theory that the fat on the back (starts face down) insulates the meat, drawing out the cooking time. If the flip happens early in the plateau, the pig will cook faster as the fat renders, basting the meat as it finishes the cook.
Sleep.
This year we added another row of fire bricks to the fire pit, and I realized we had purchased a whole bunch that we 1/4” too thick. Bummer. There is always a silver lining however - next year I plan to load them into the smoker to help stabilize the temperature as they should do a good job storing heat between shovelfuls of charcoal.
Baron’s hot sauce is a good addition.
Take more photos.
Cut the cracklins into smaller pieces before putting in the oven.
This year was the best yet, and the good news is there are still lots of improvements for next year. Looking forward to it!
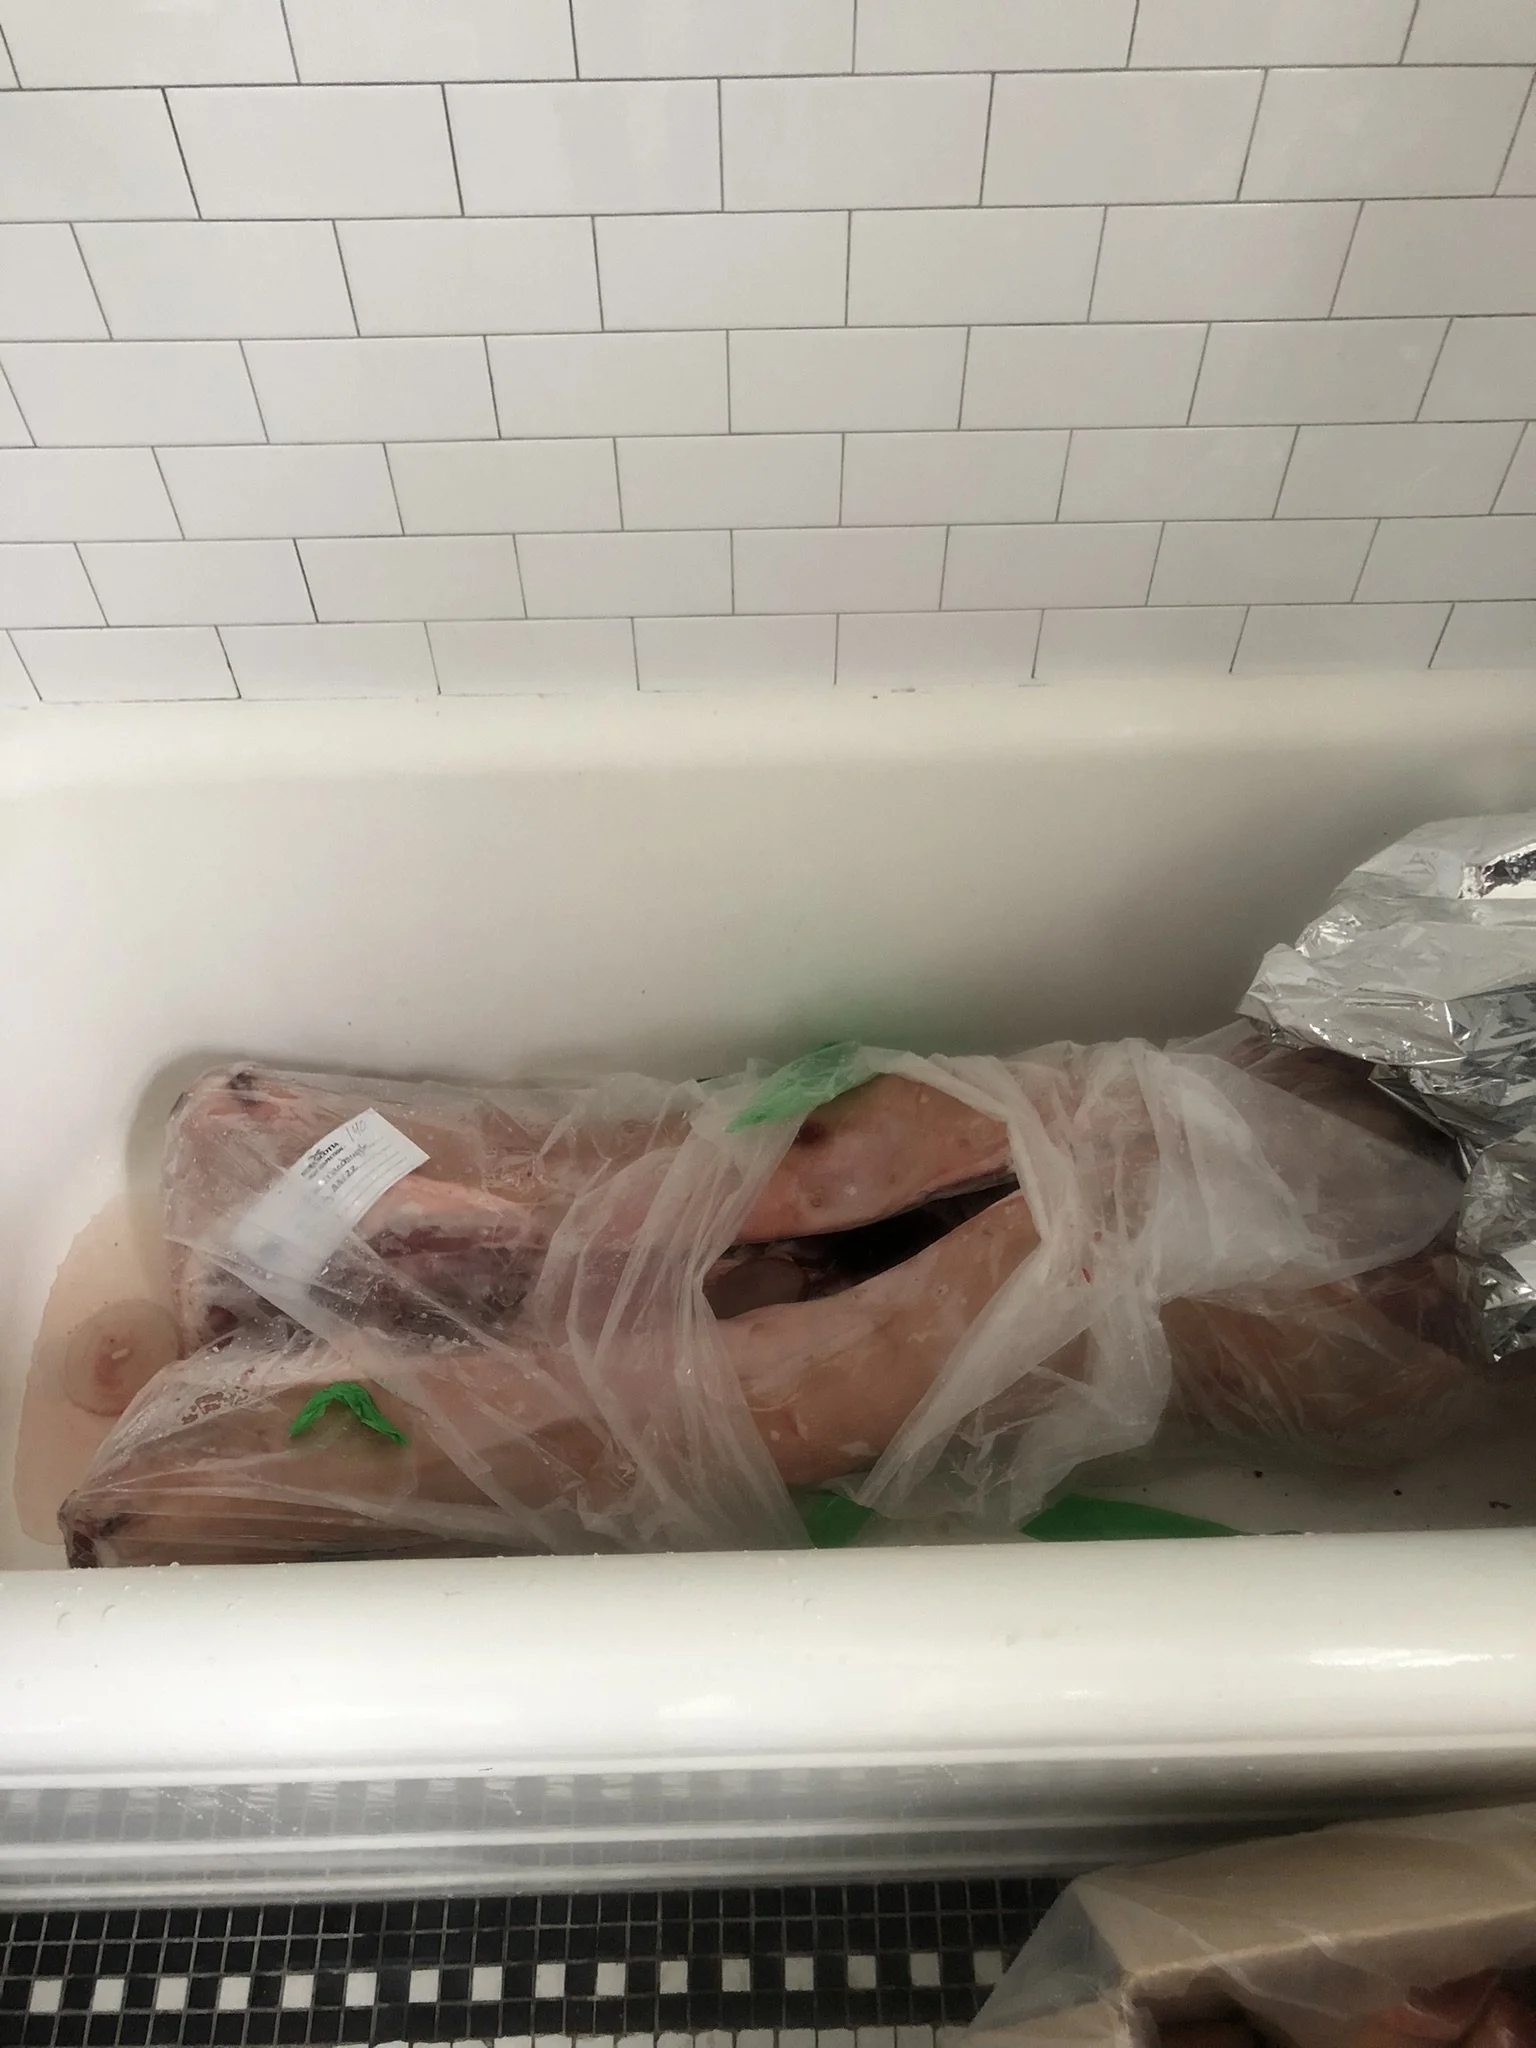
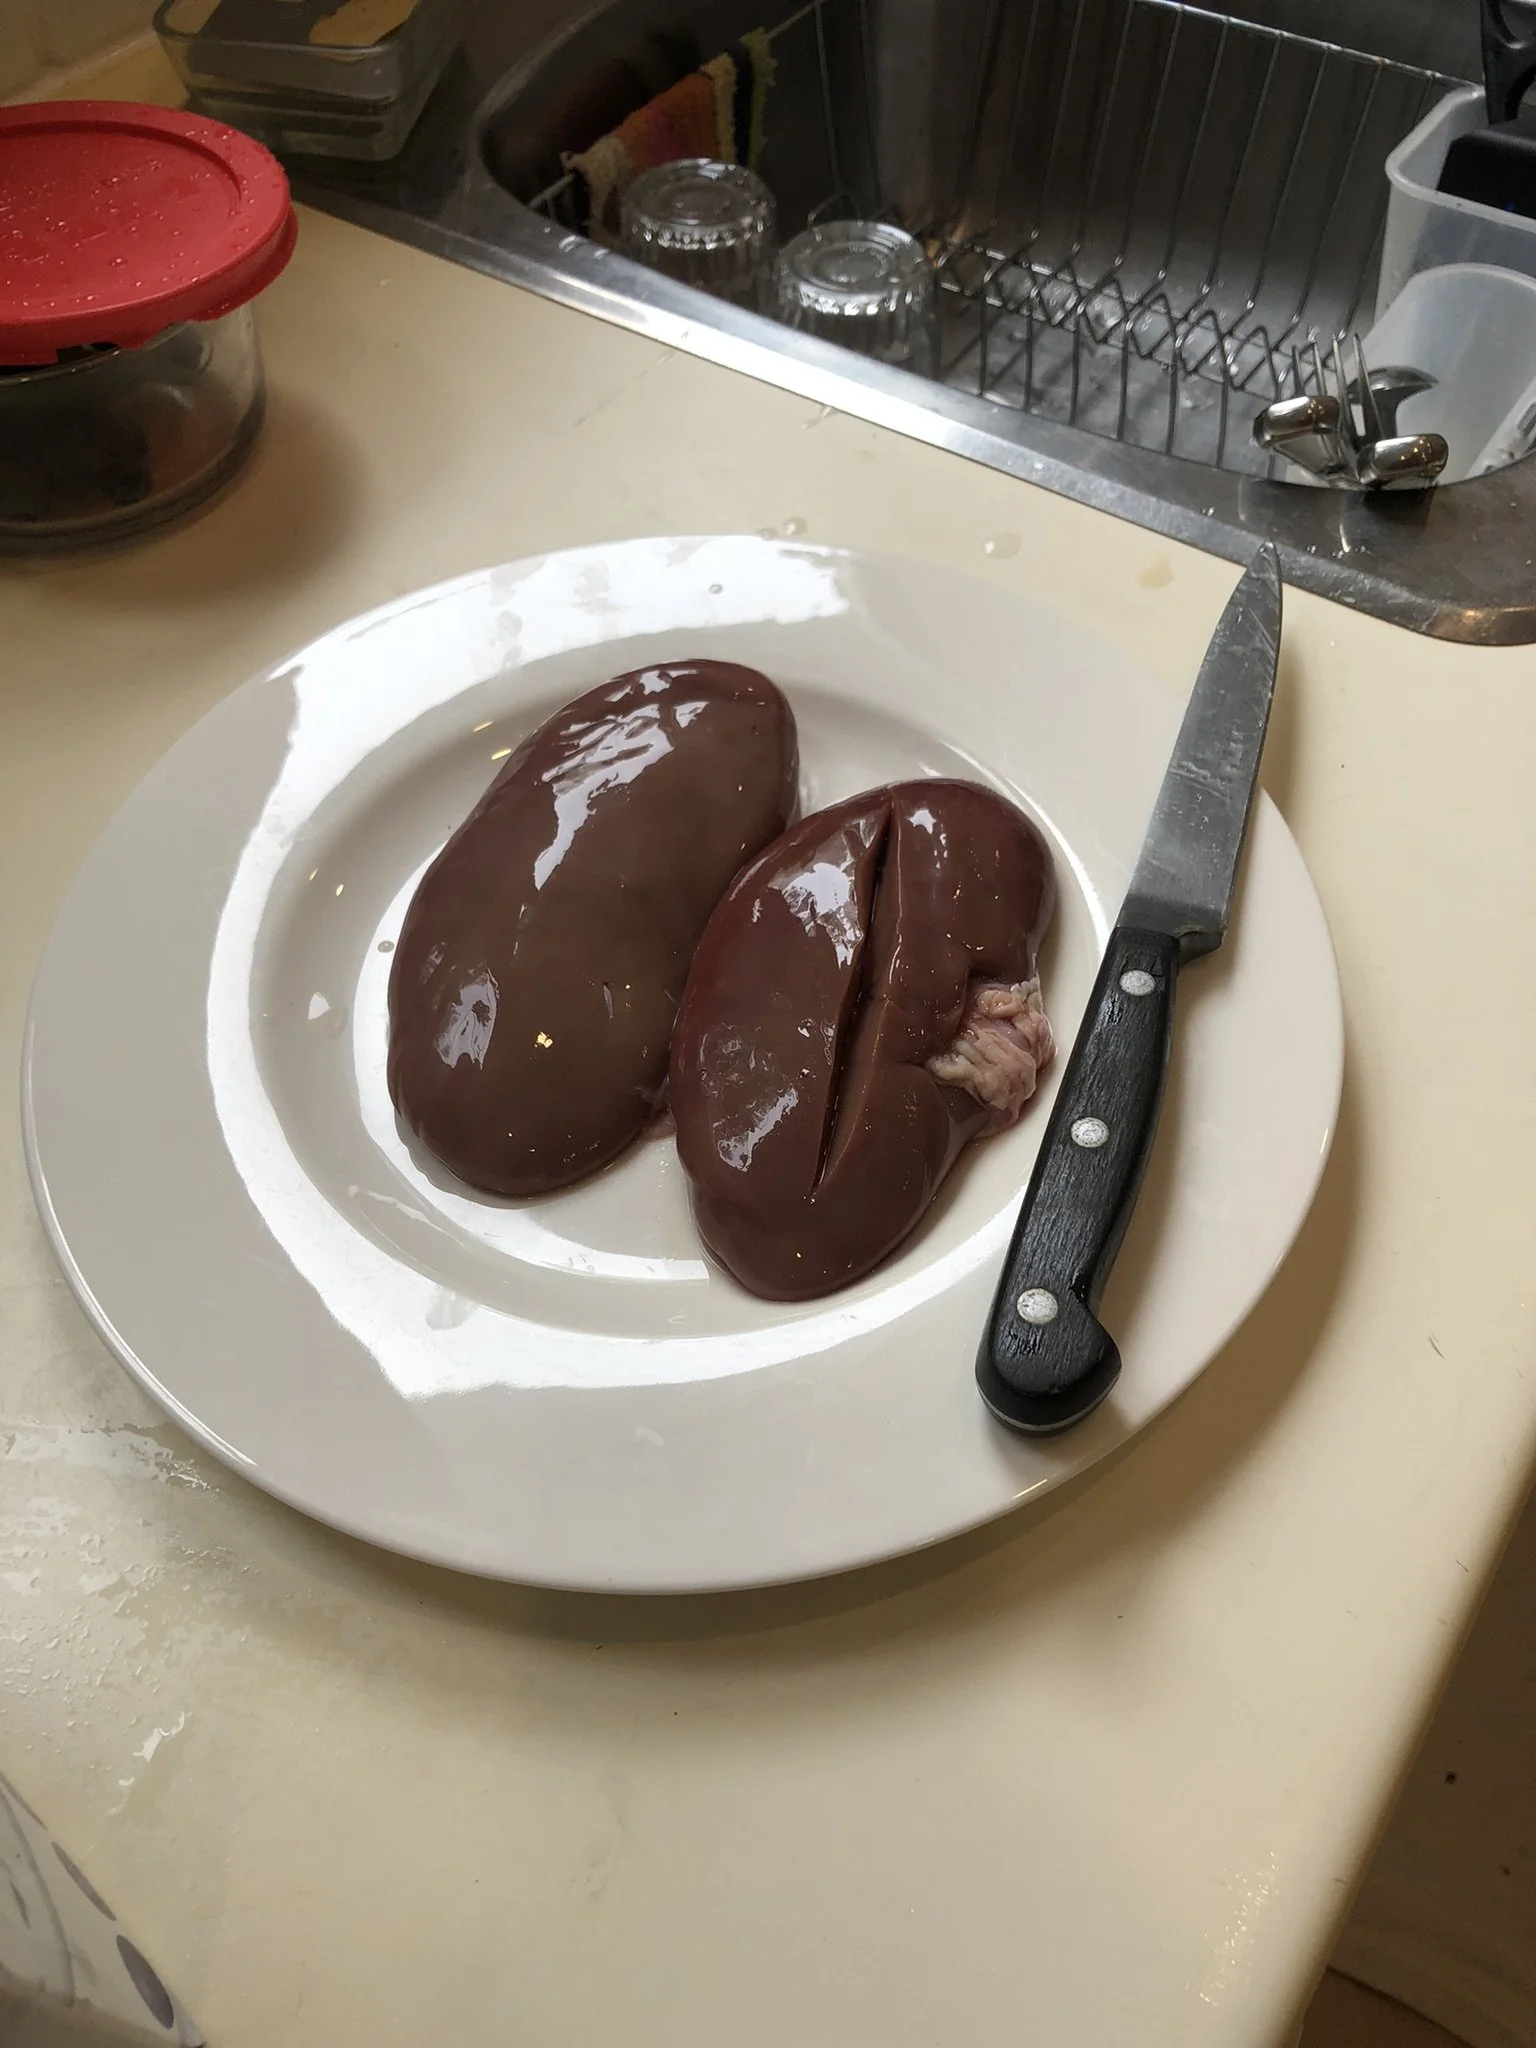
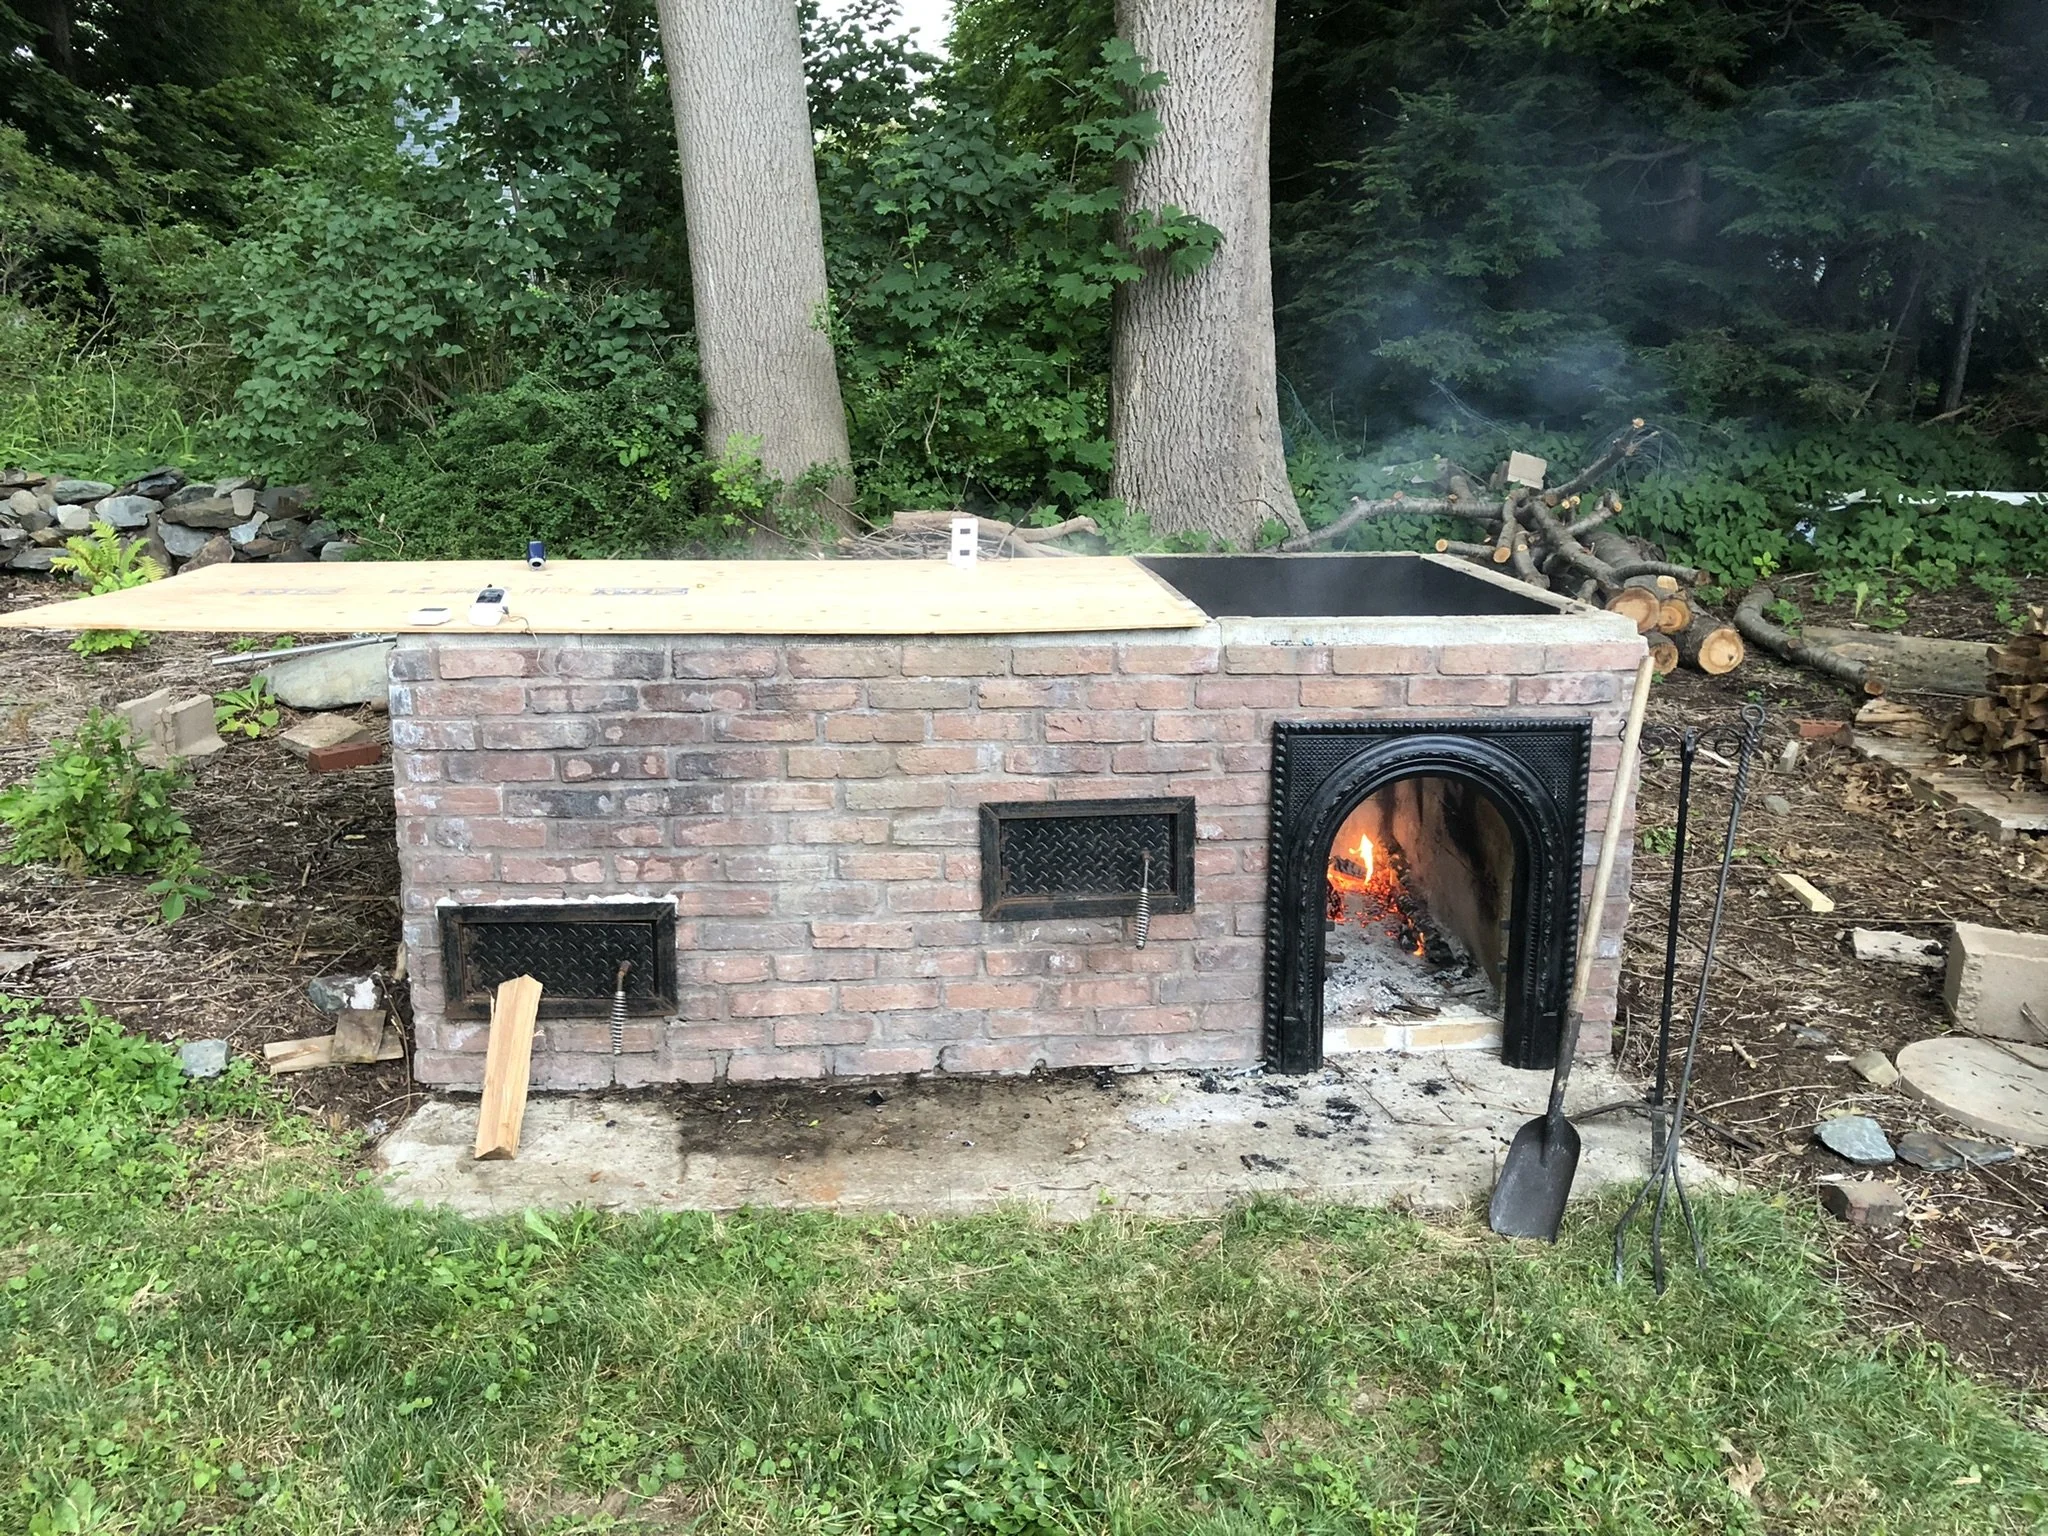
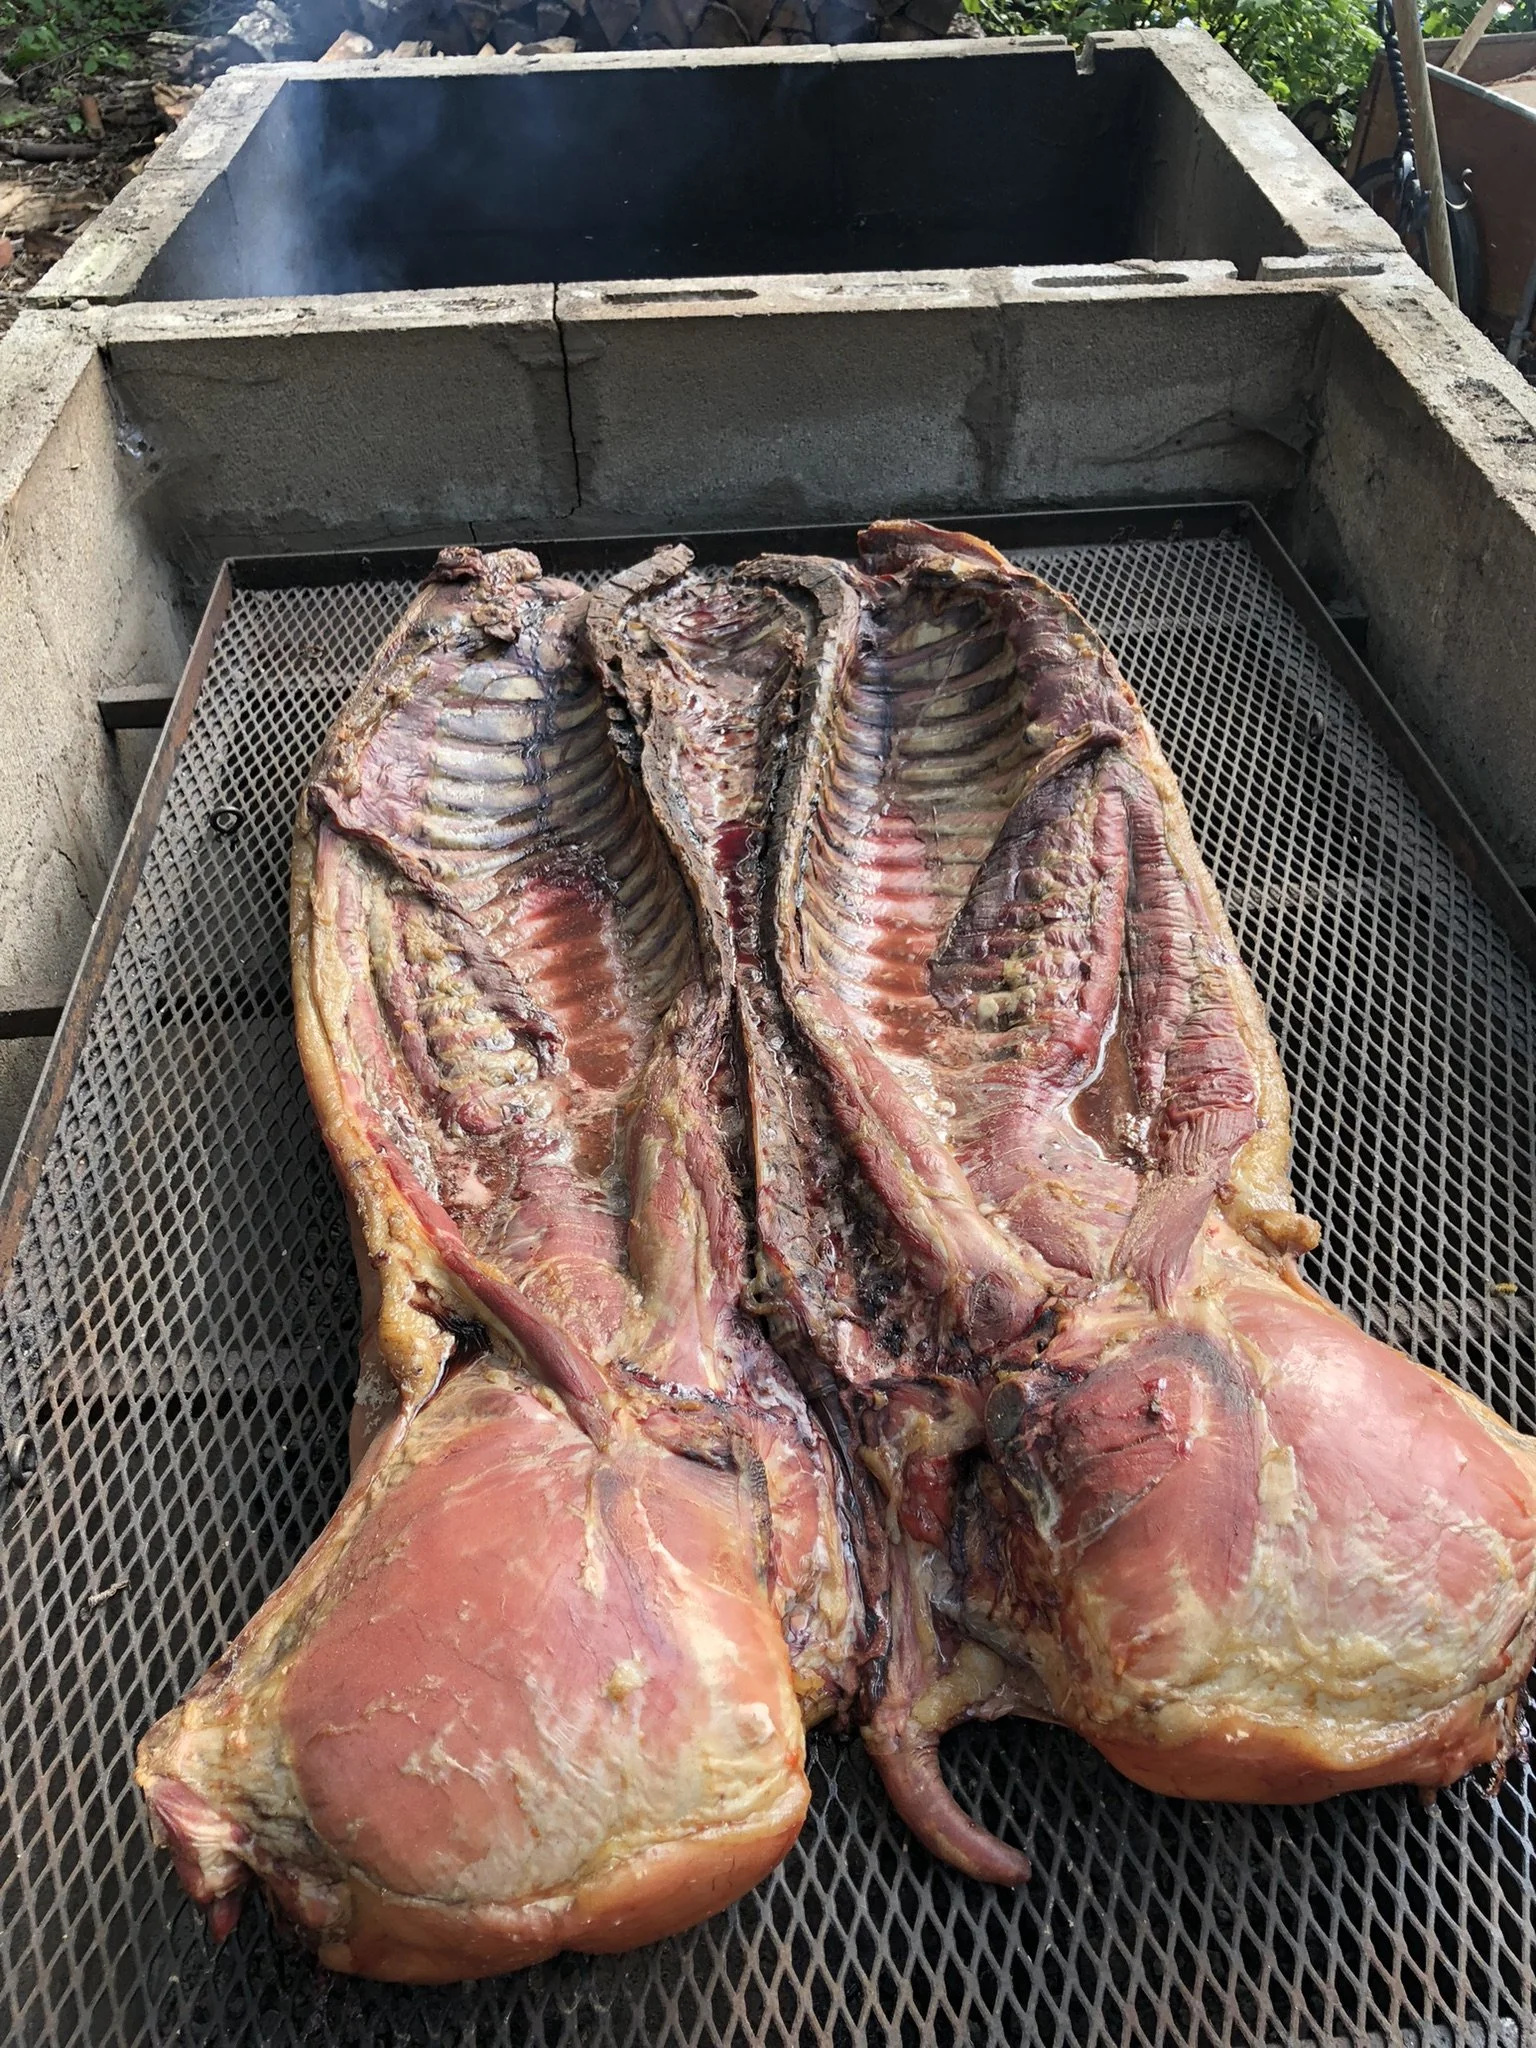
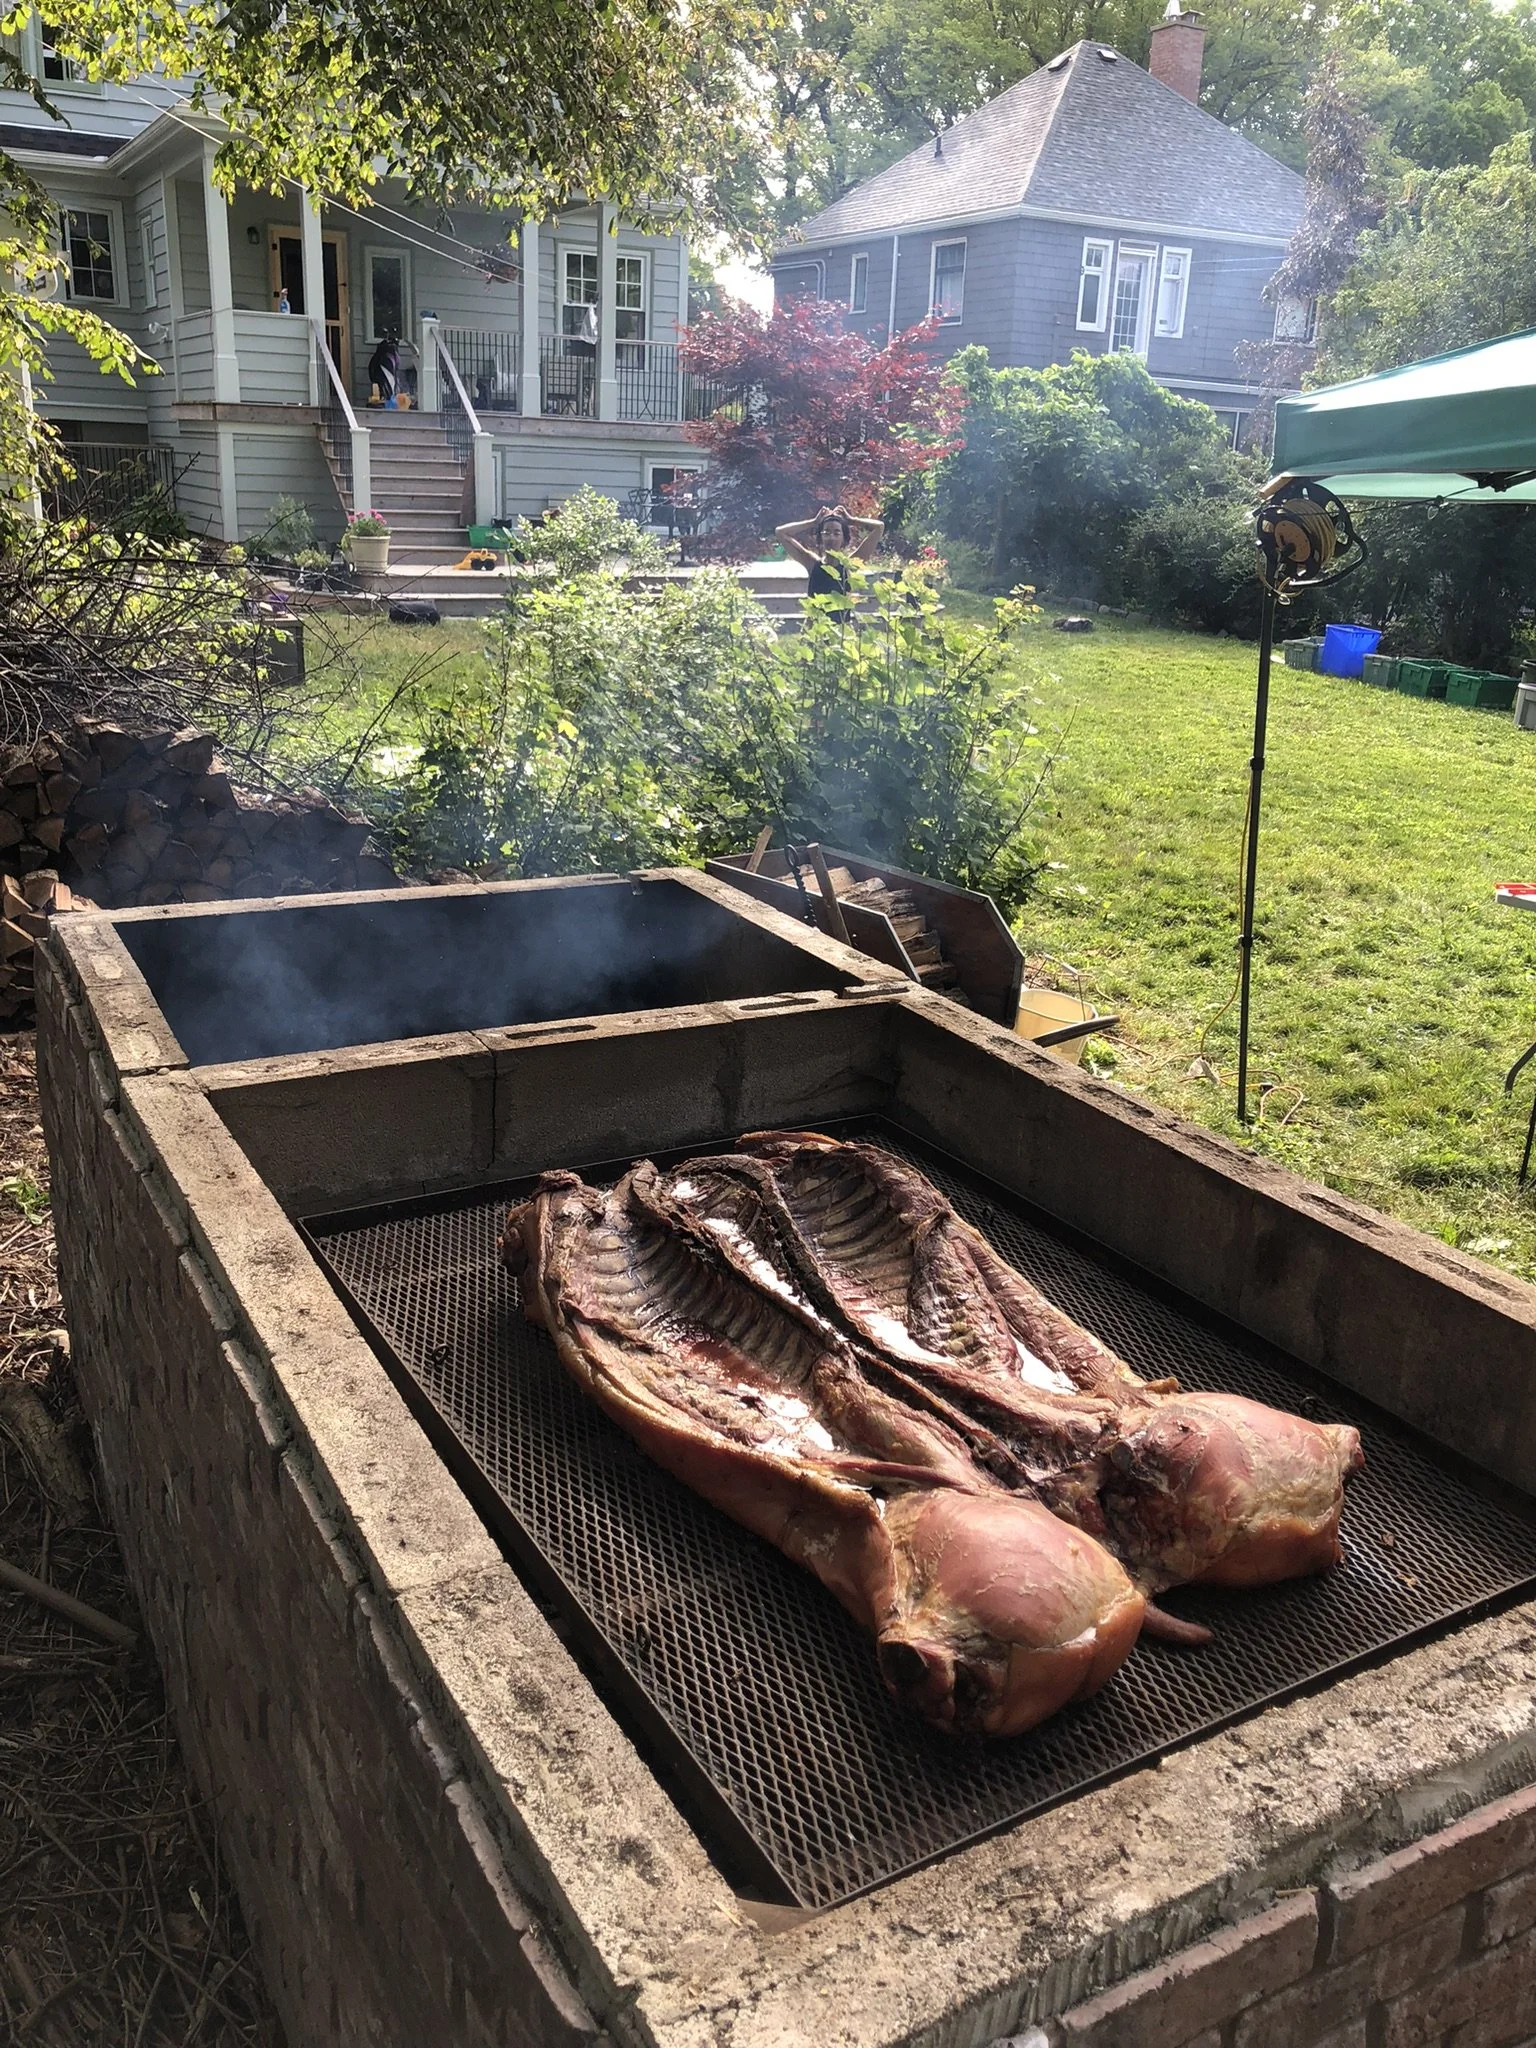
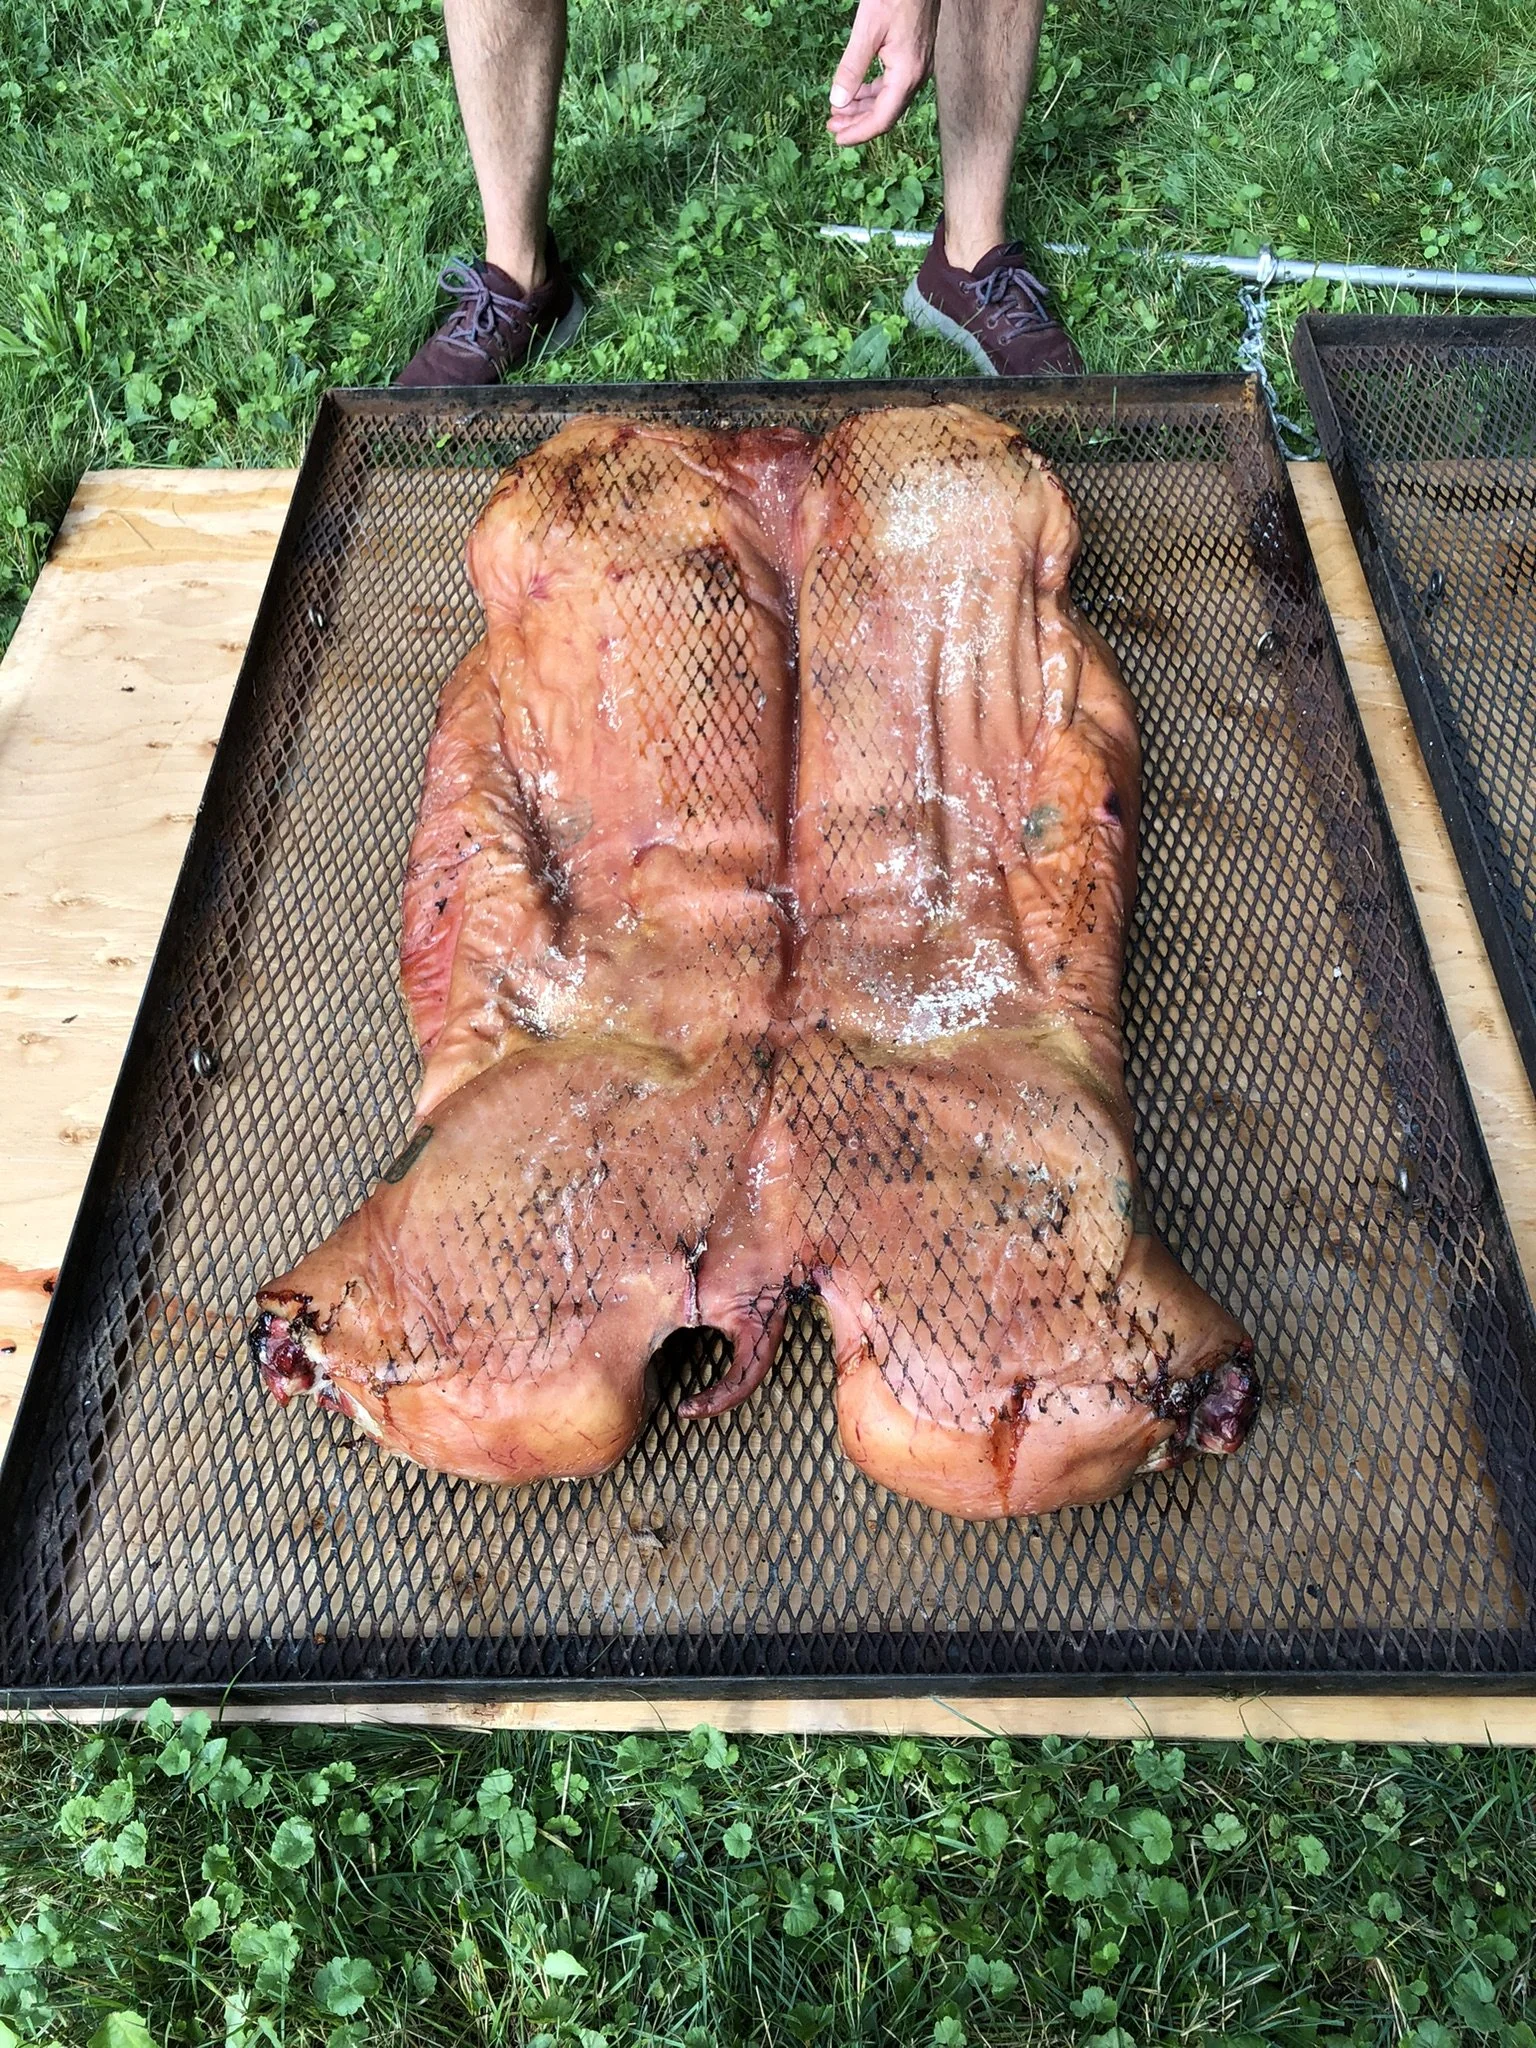
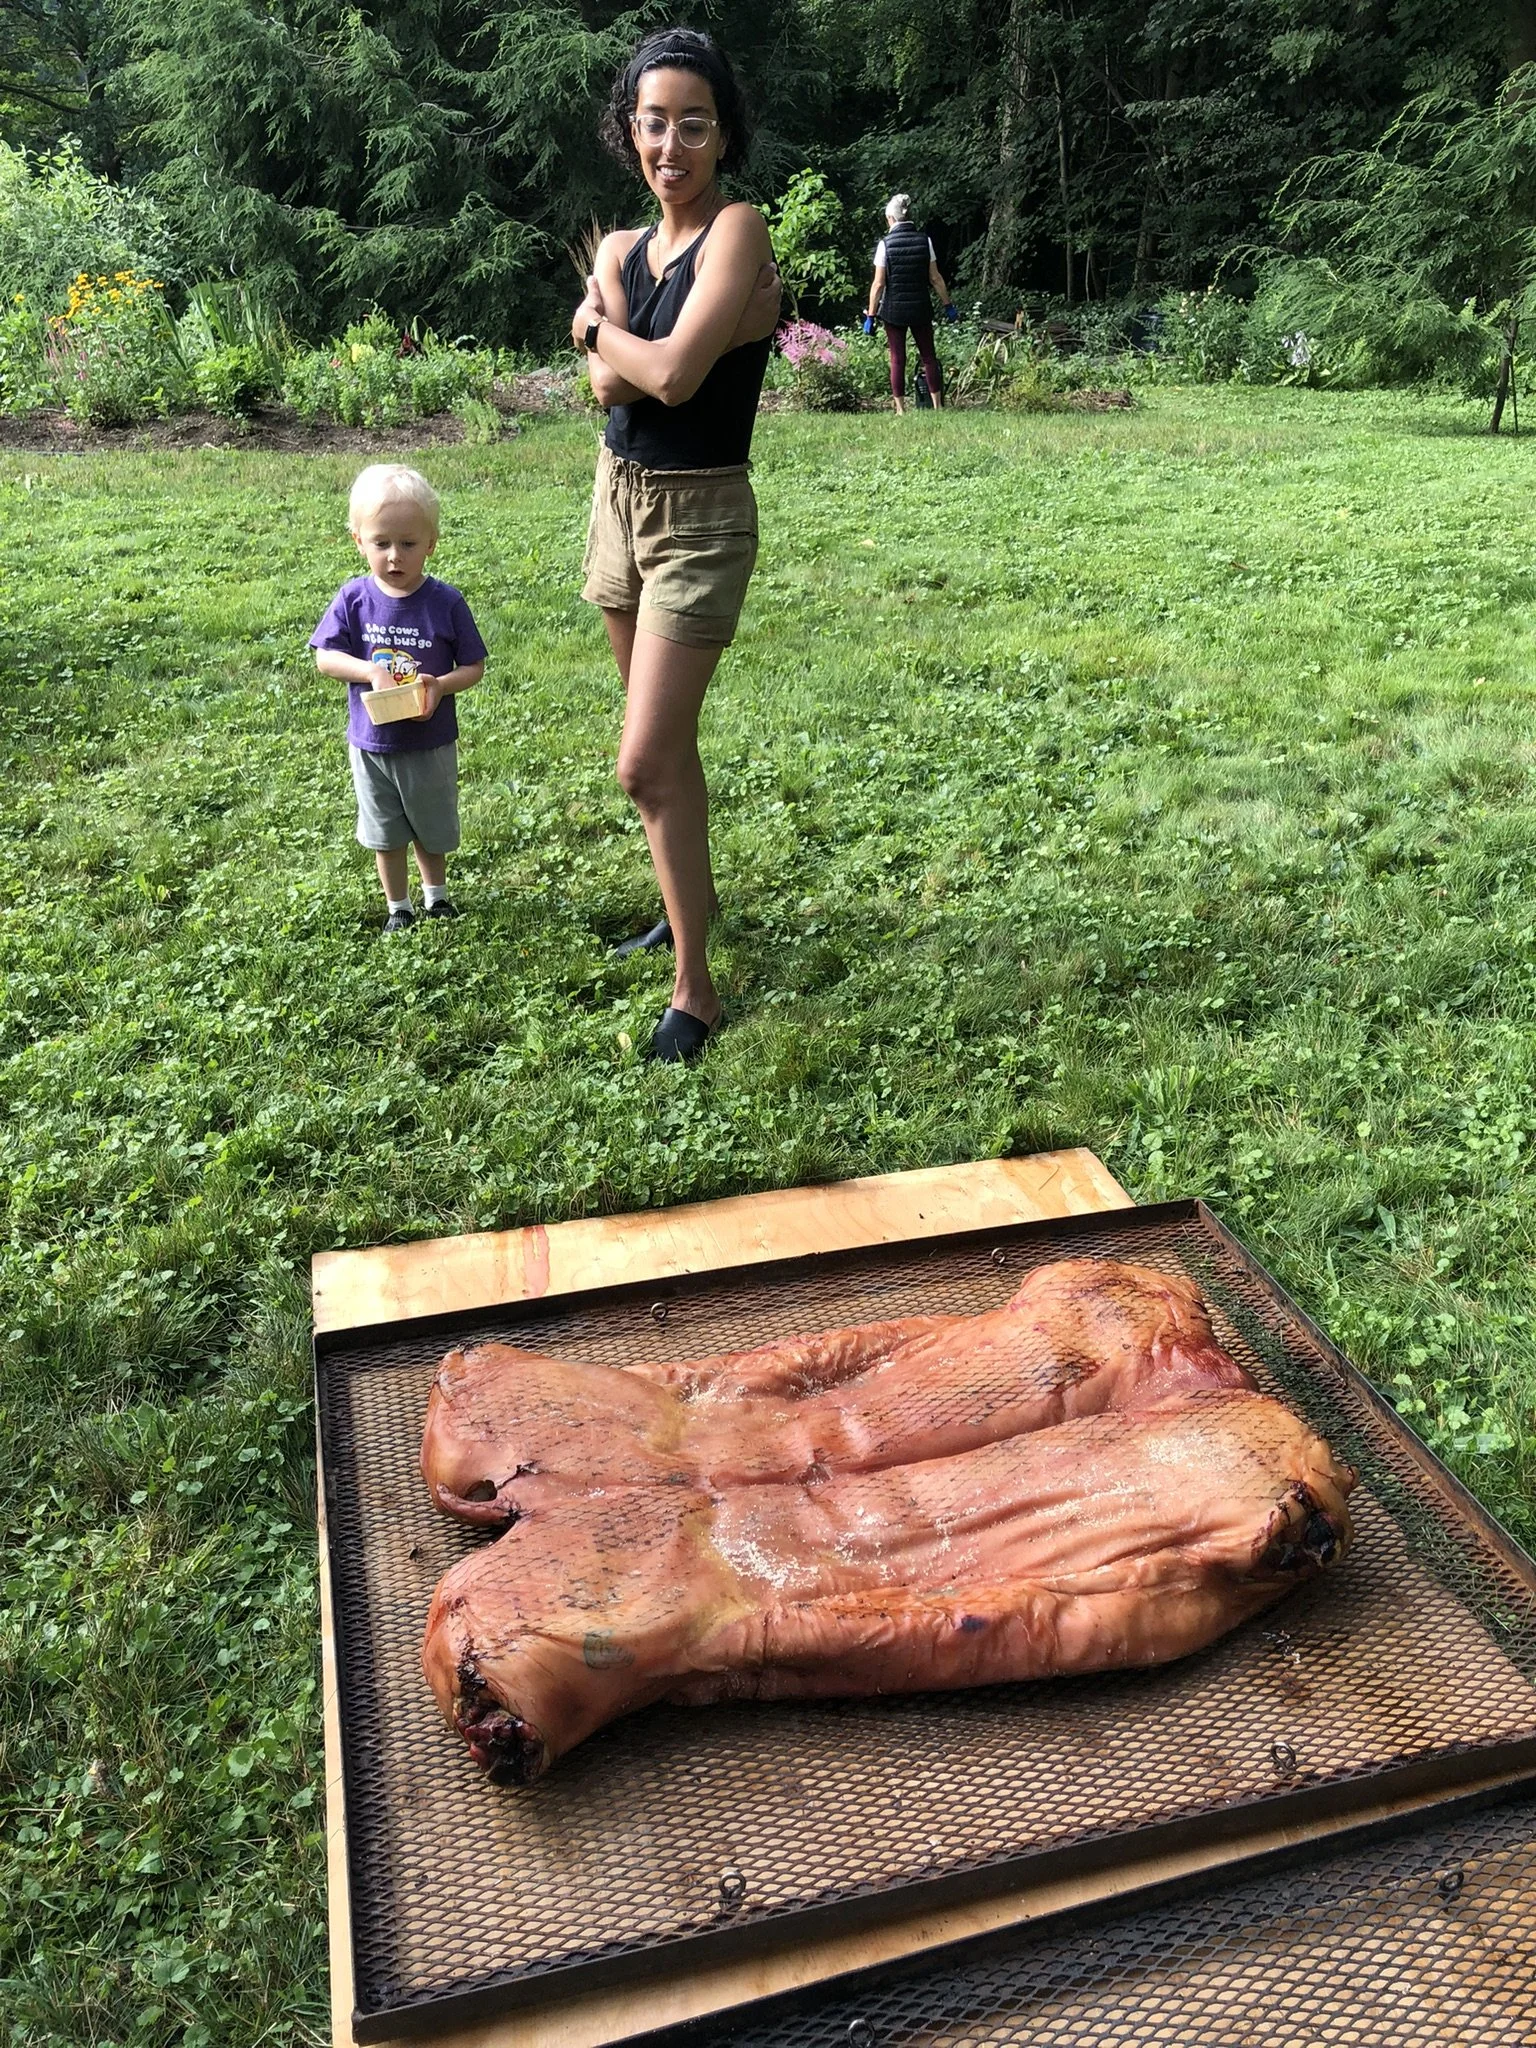
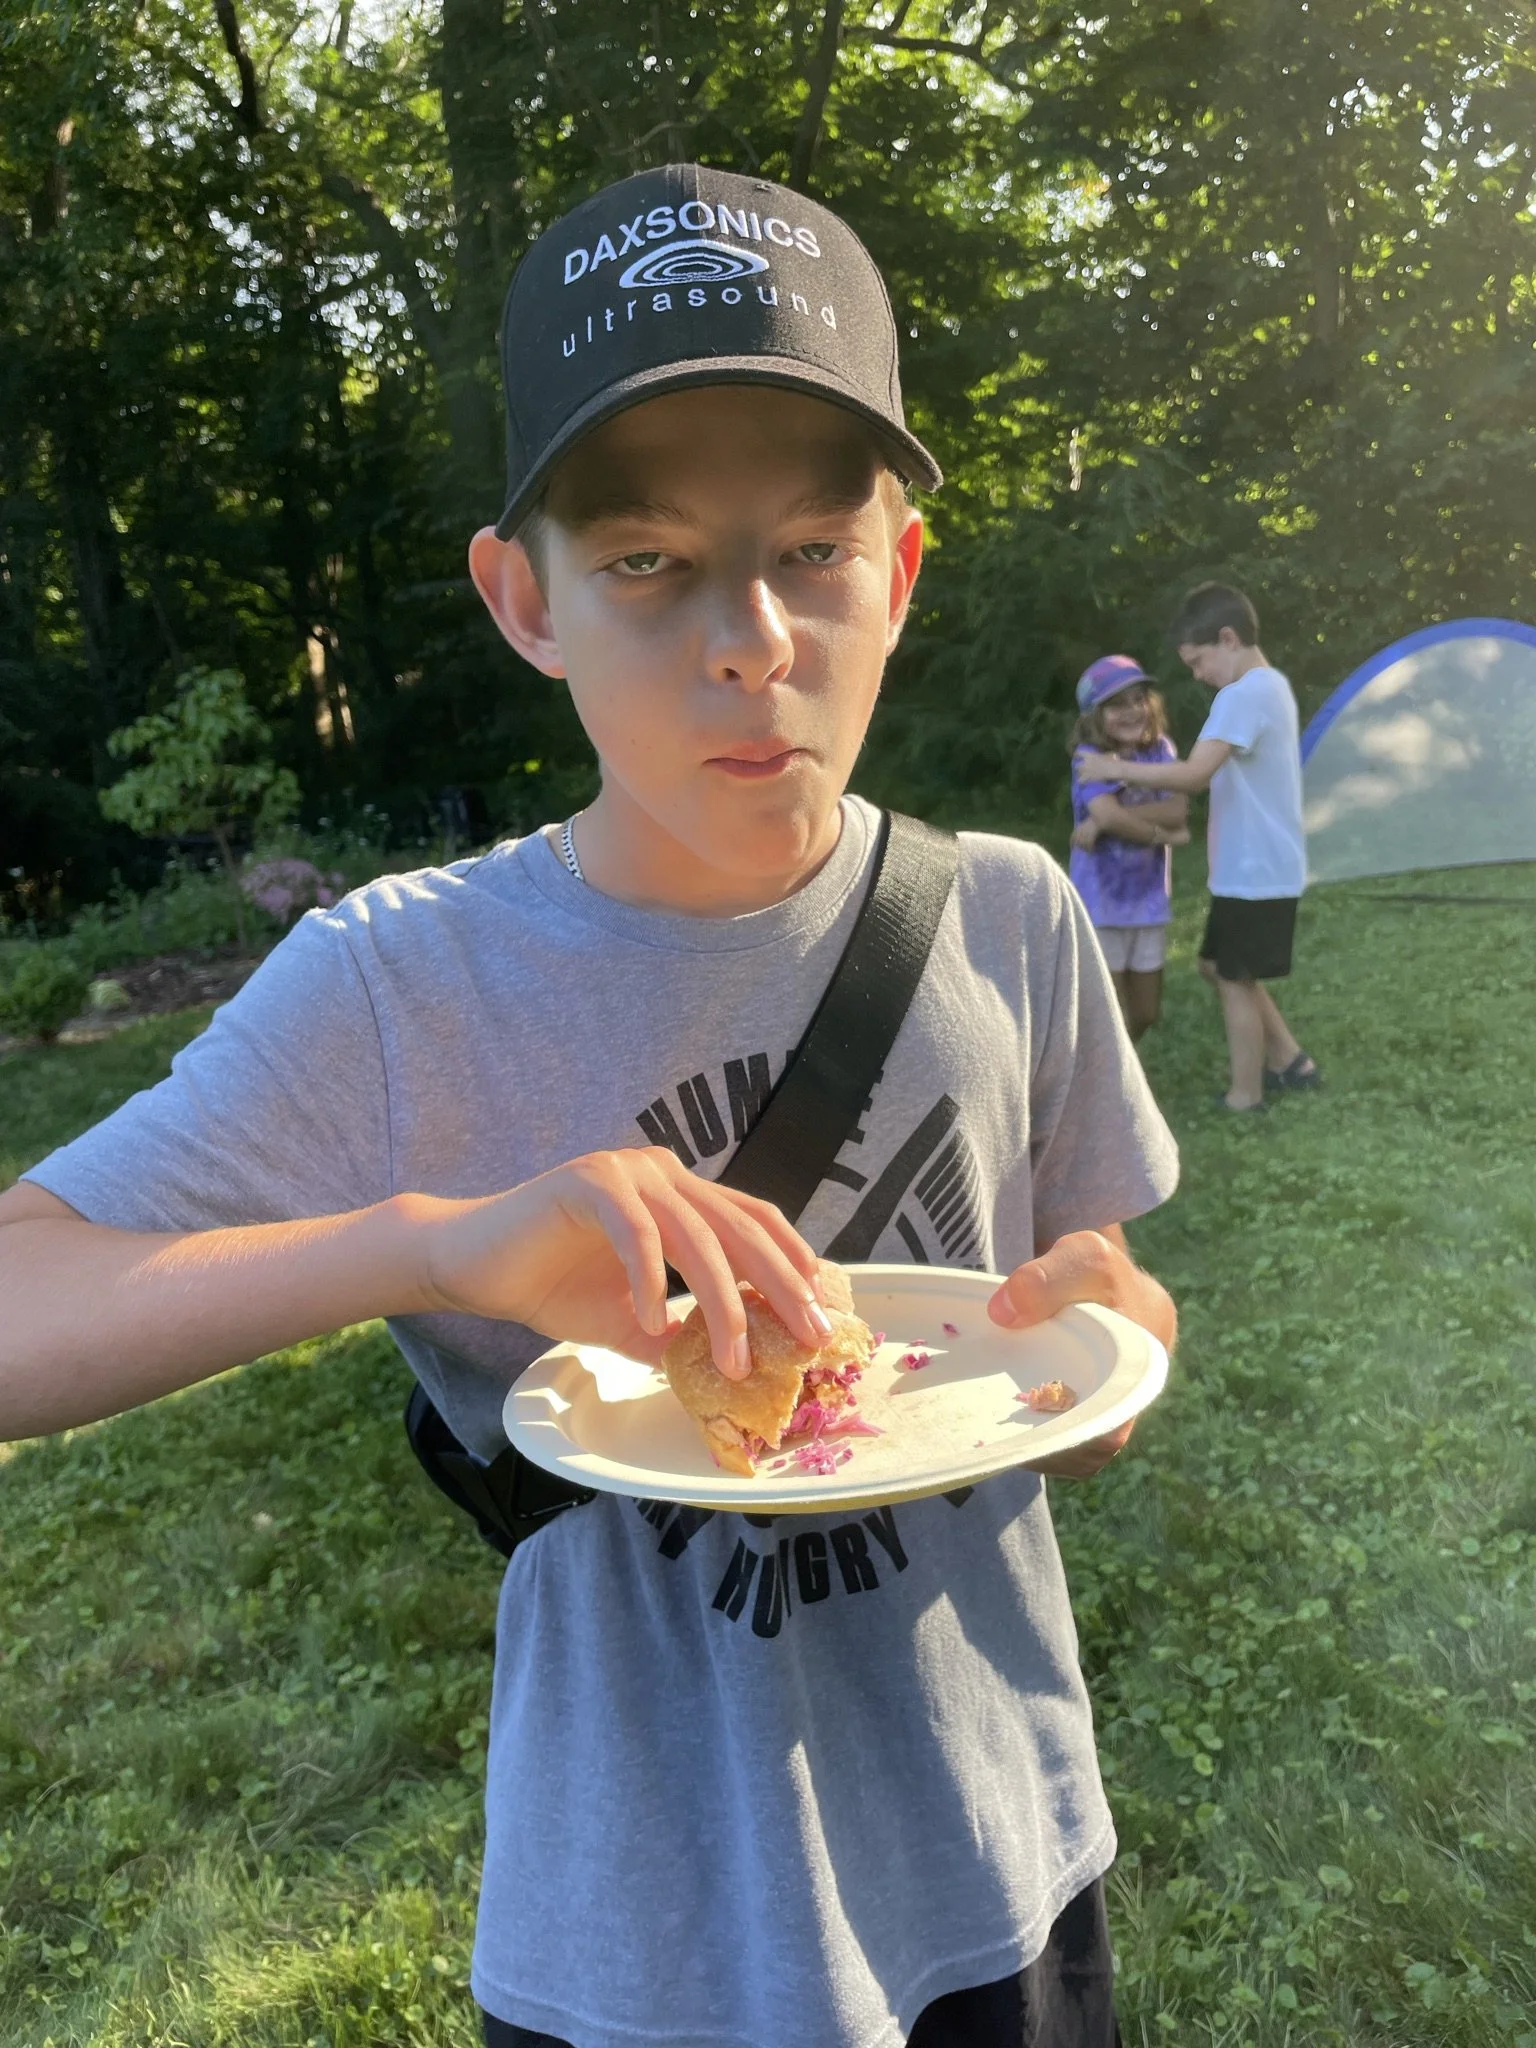
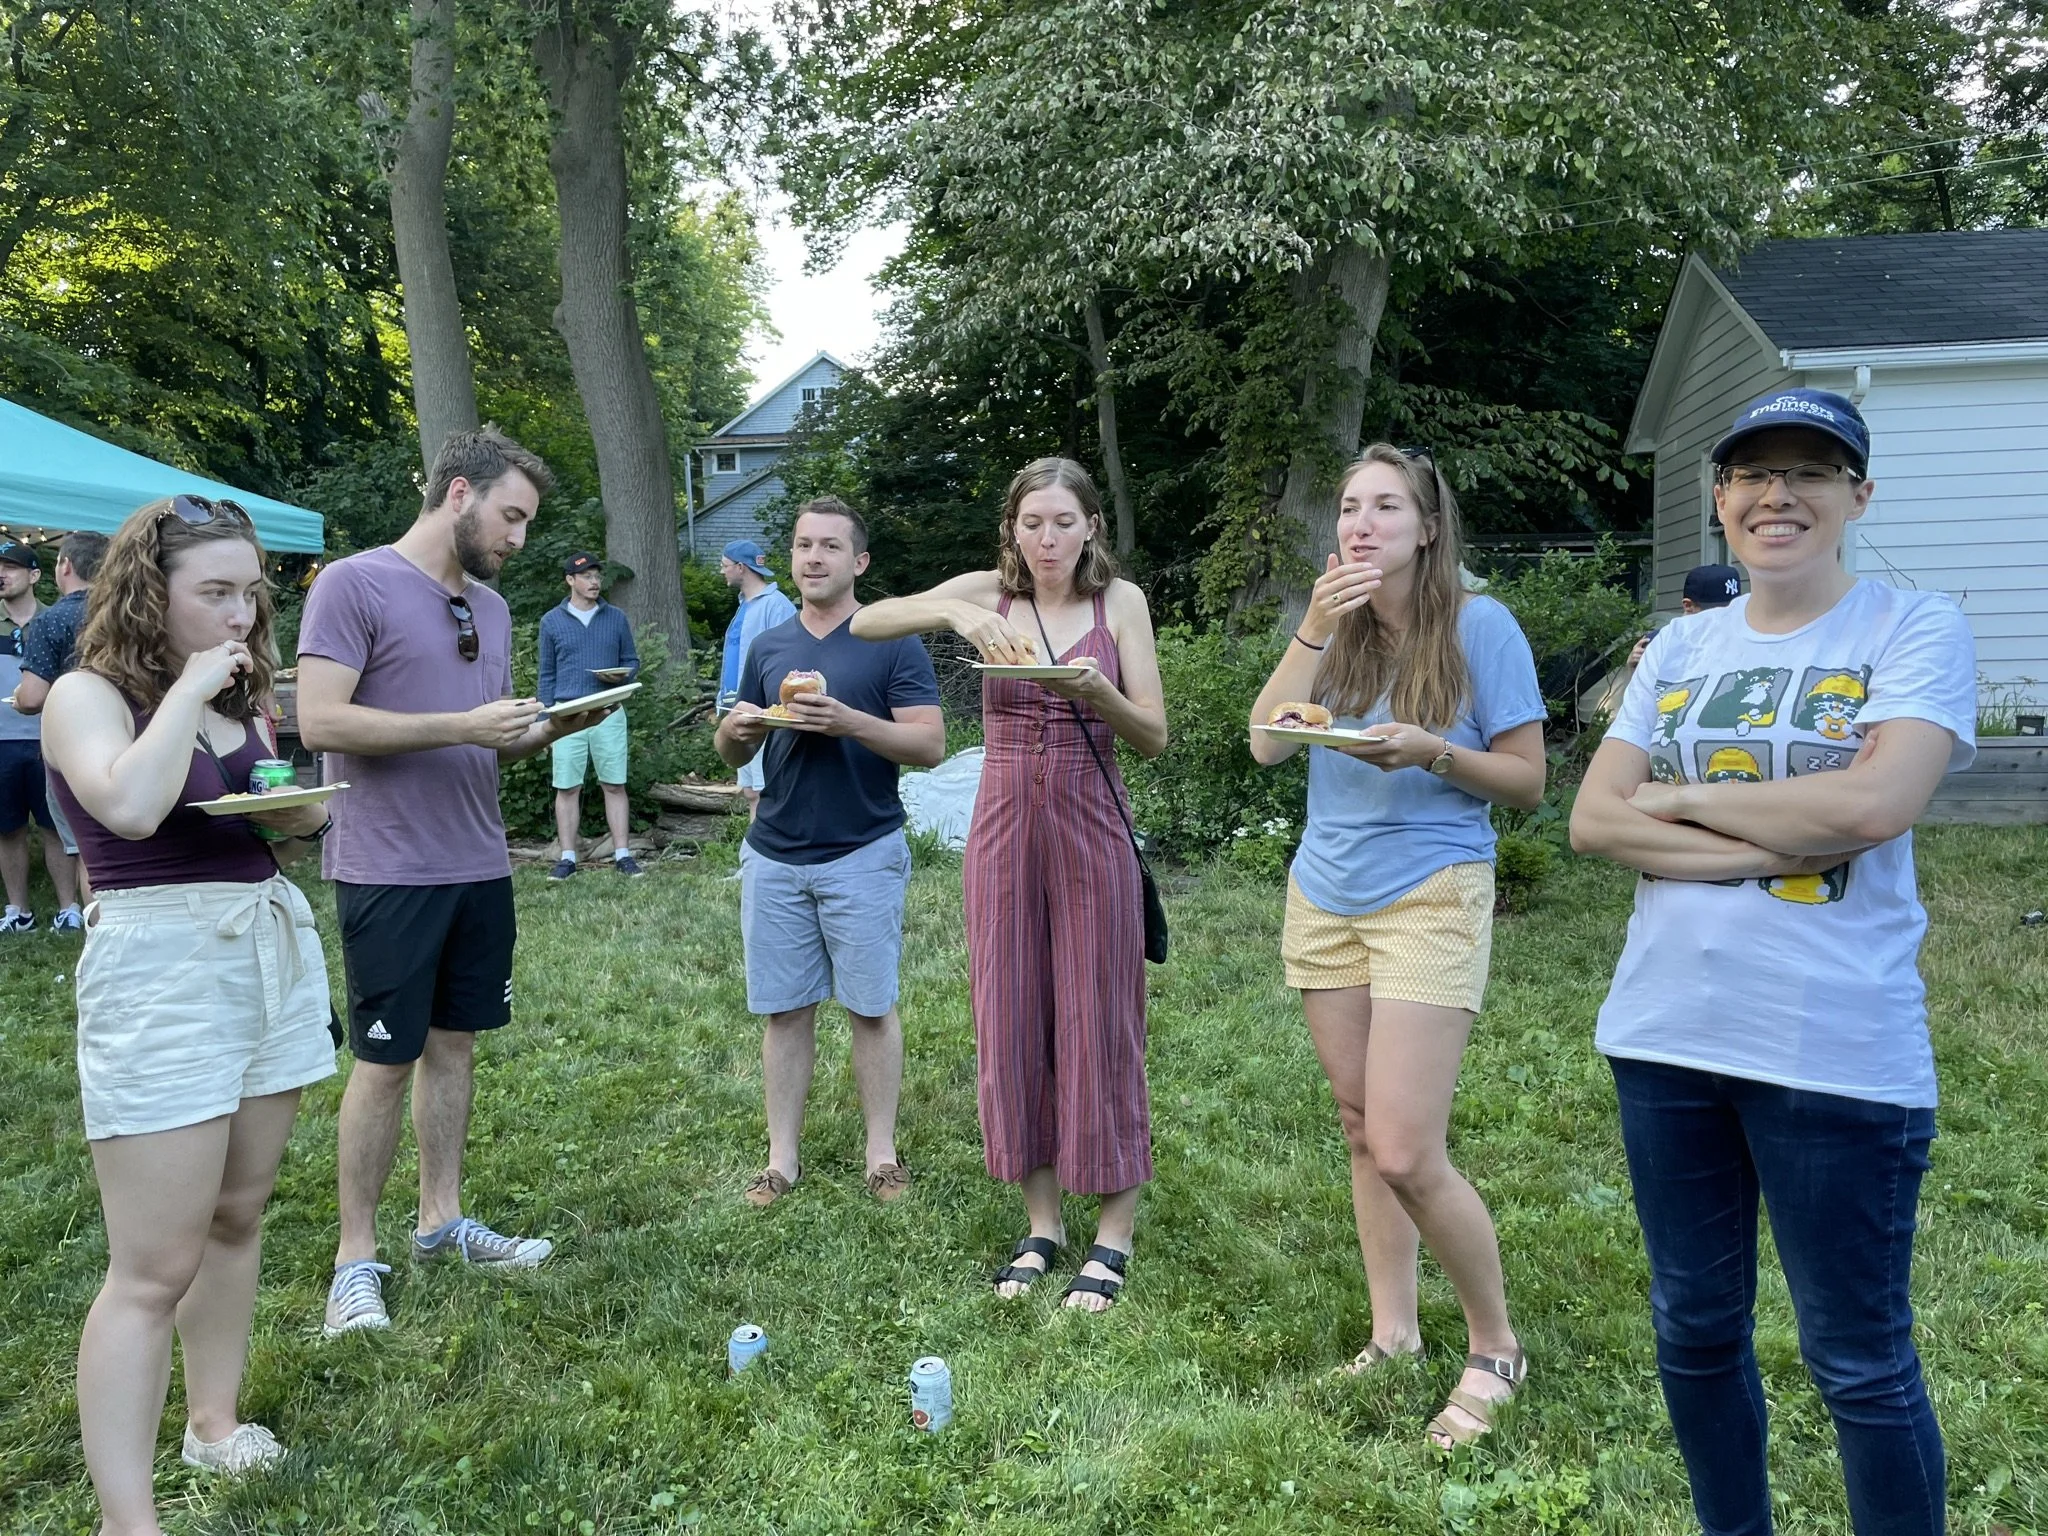
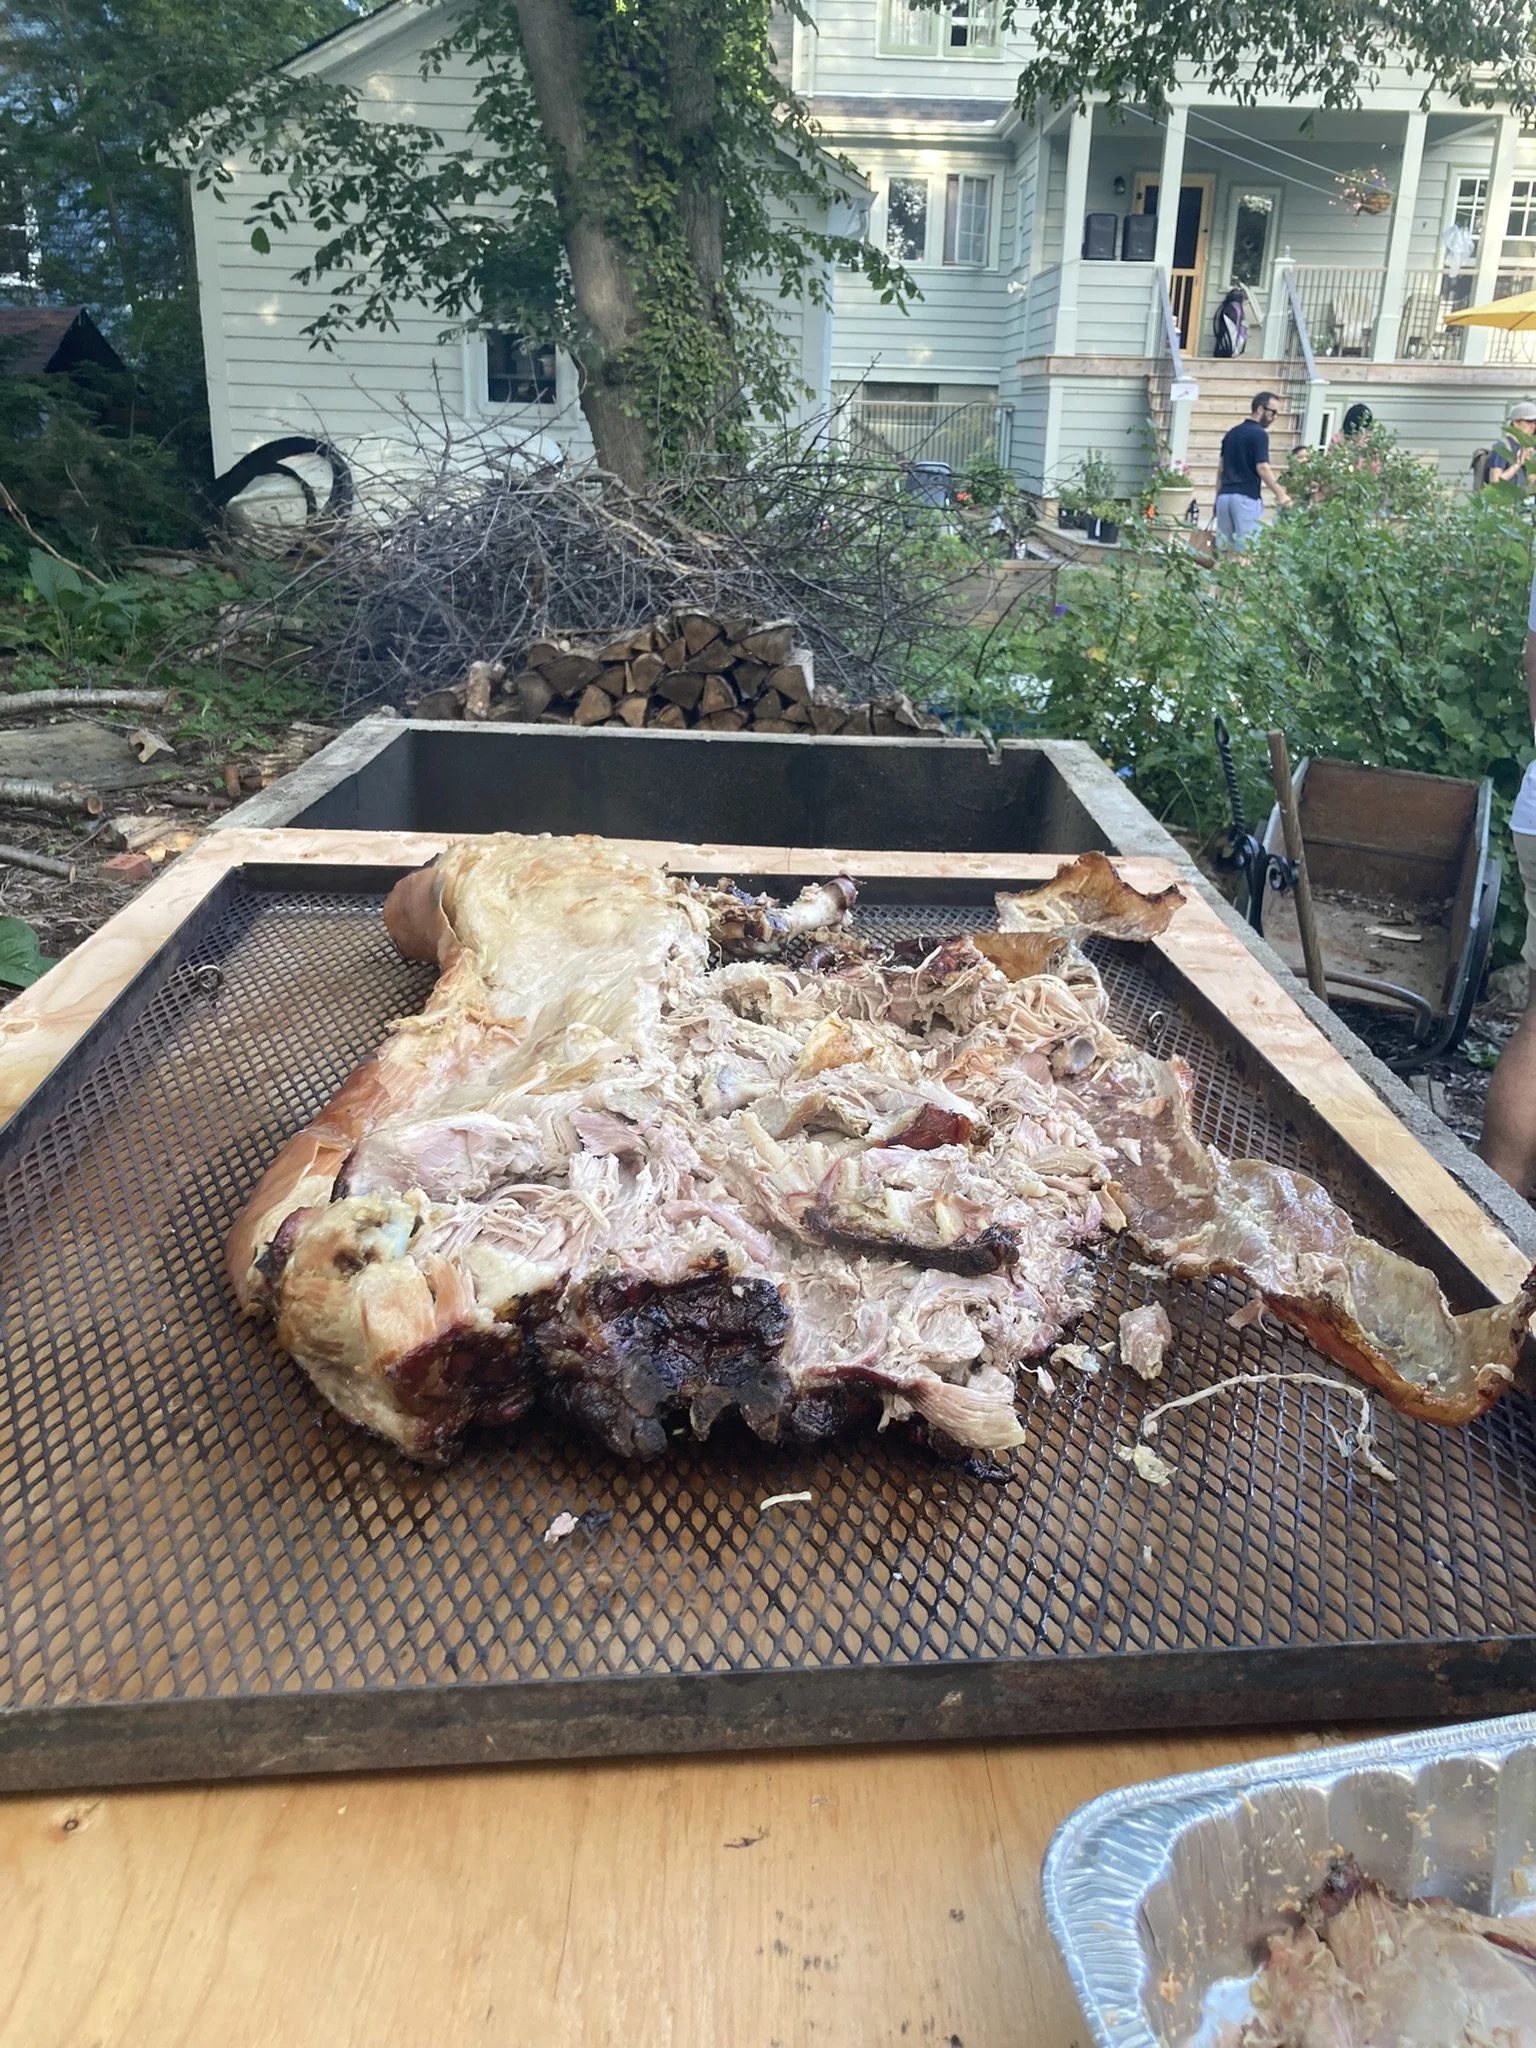
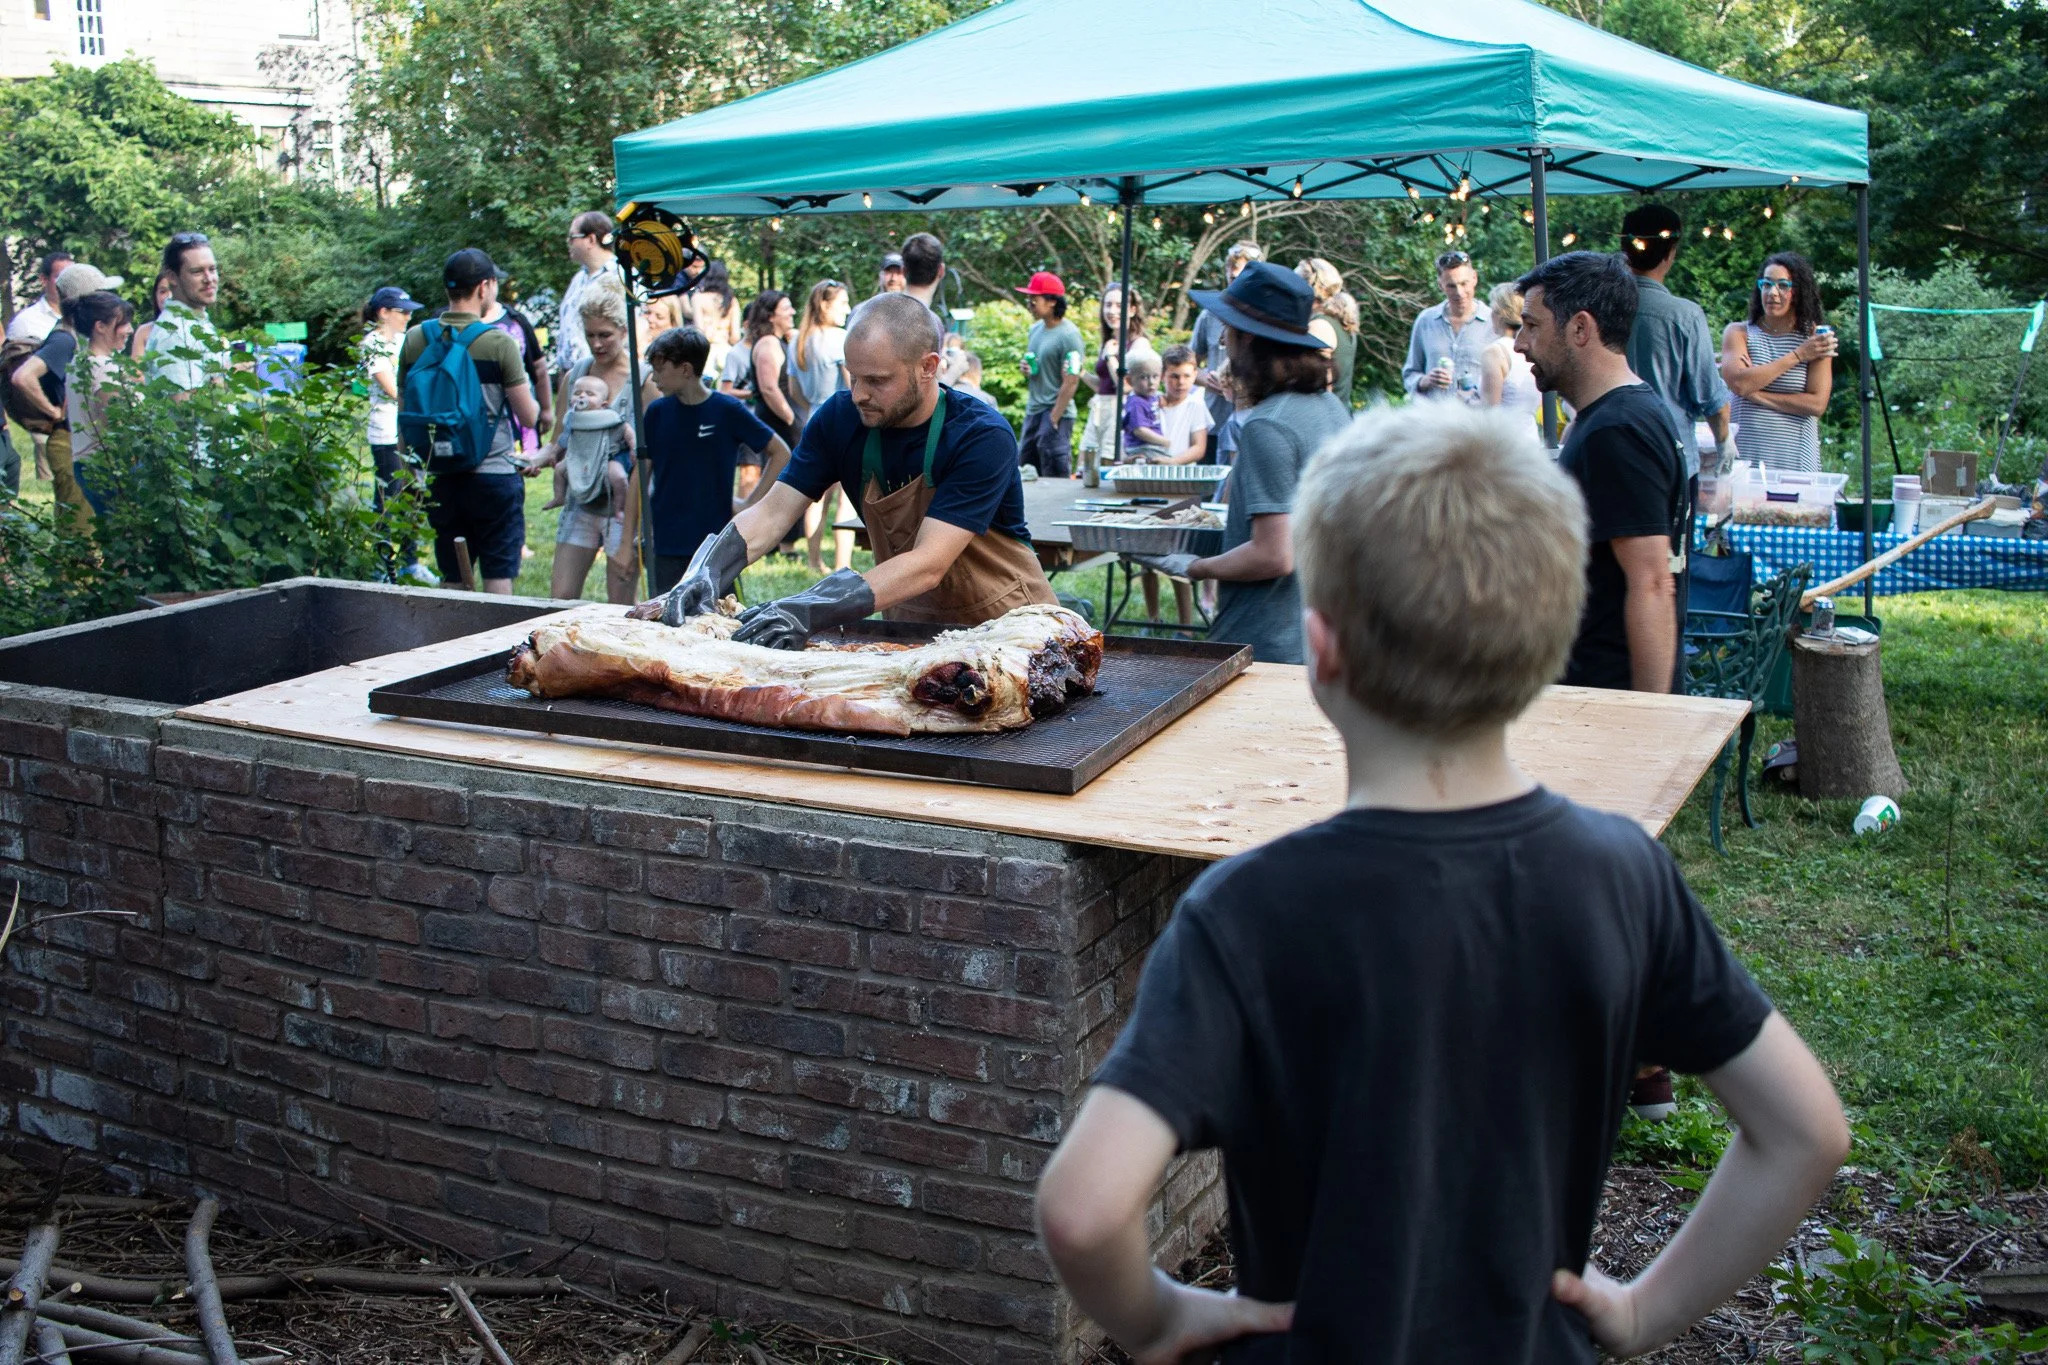
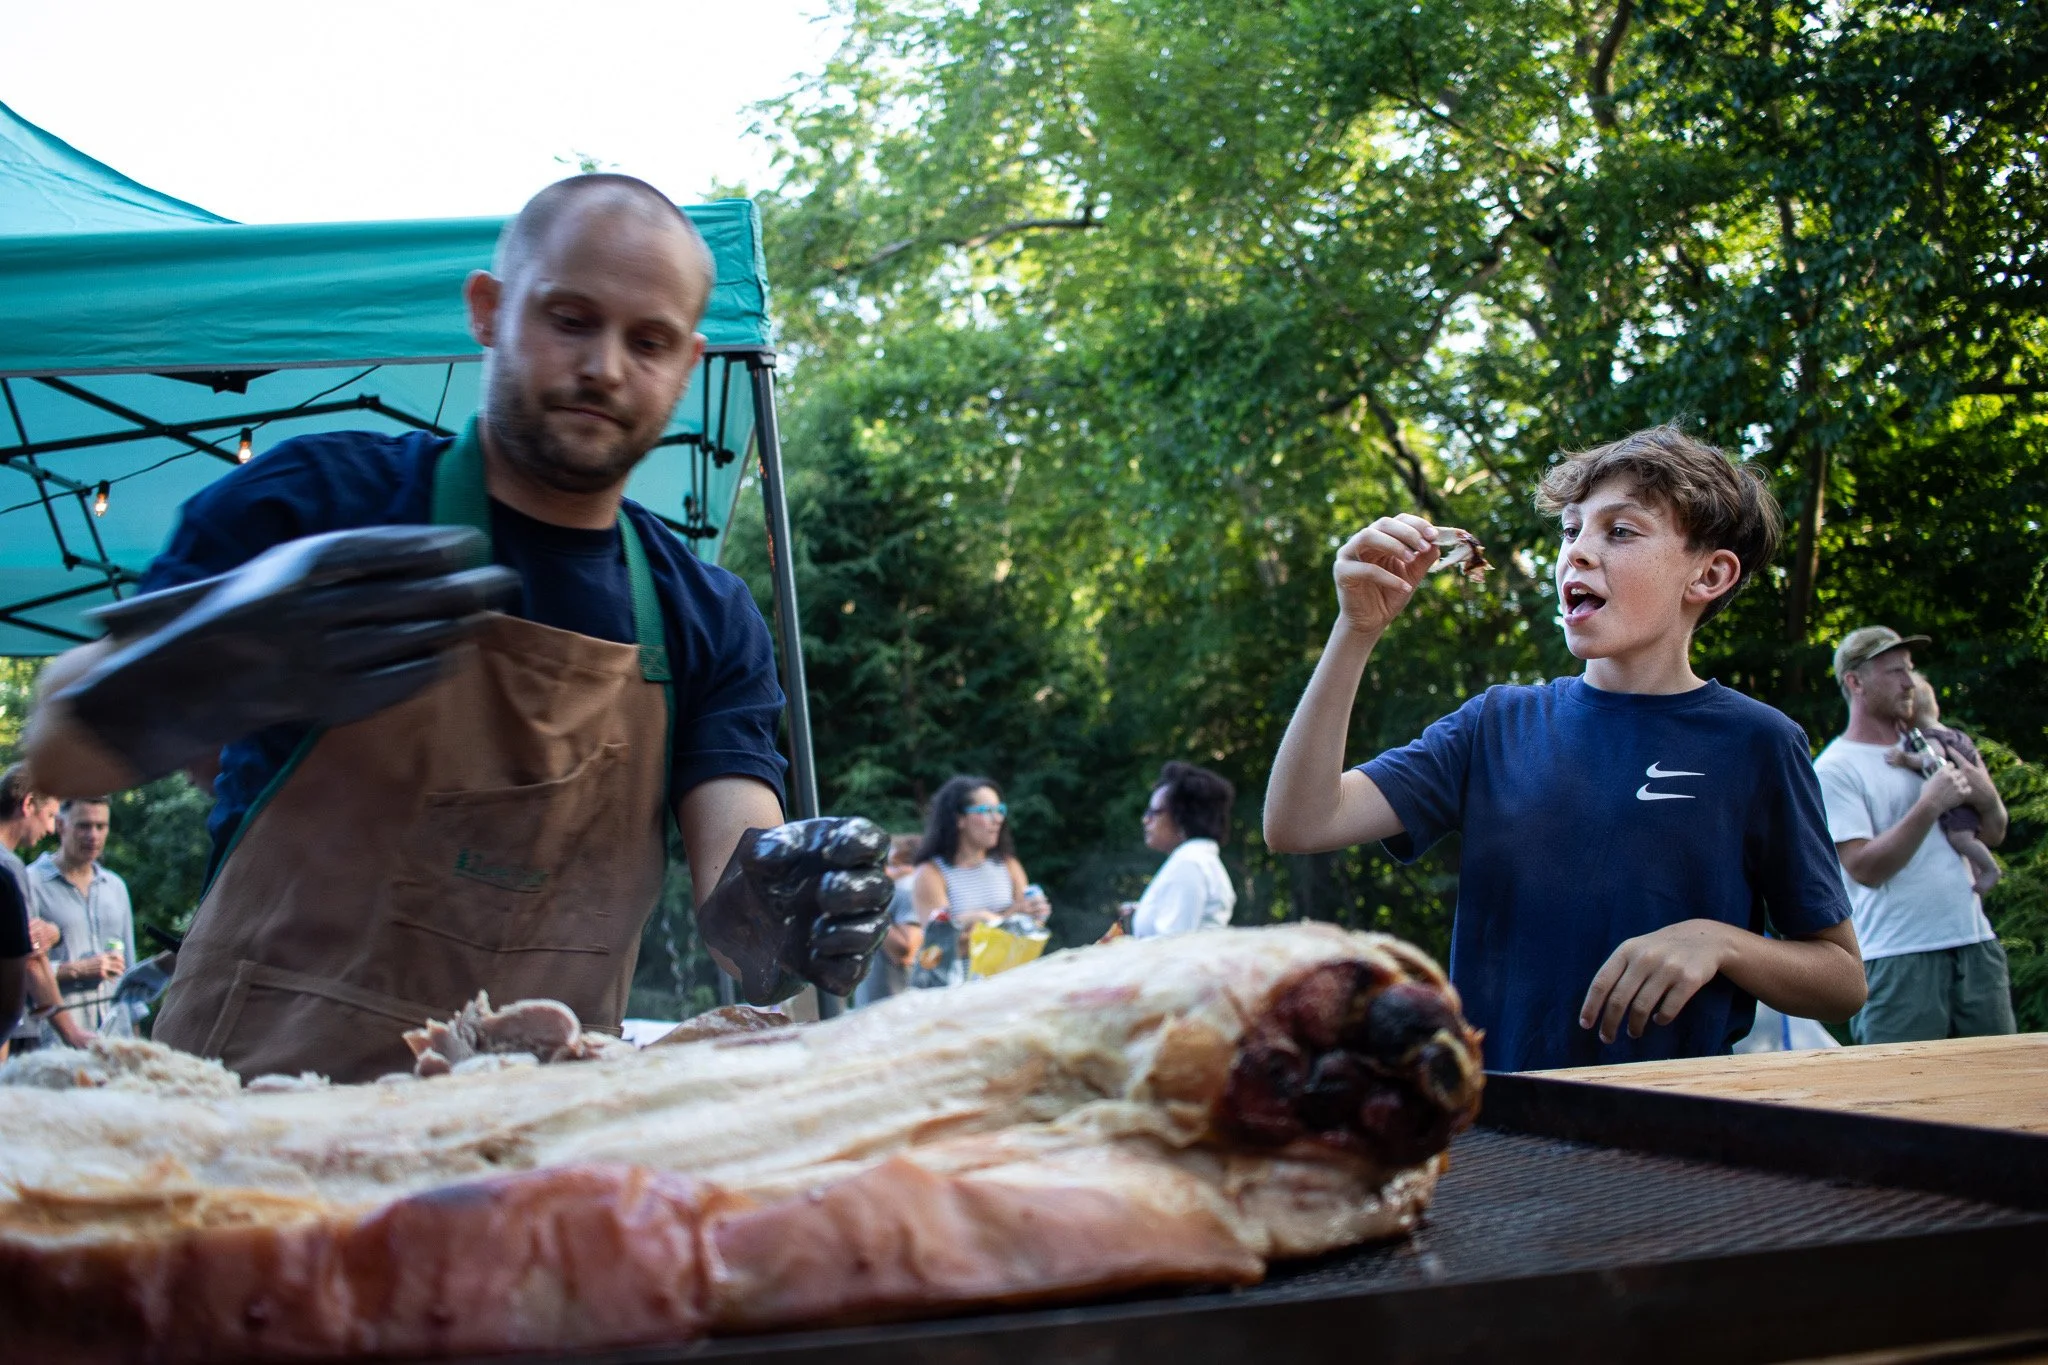
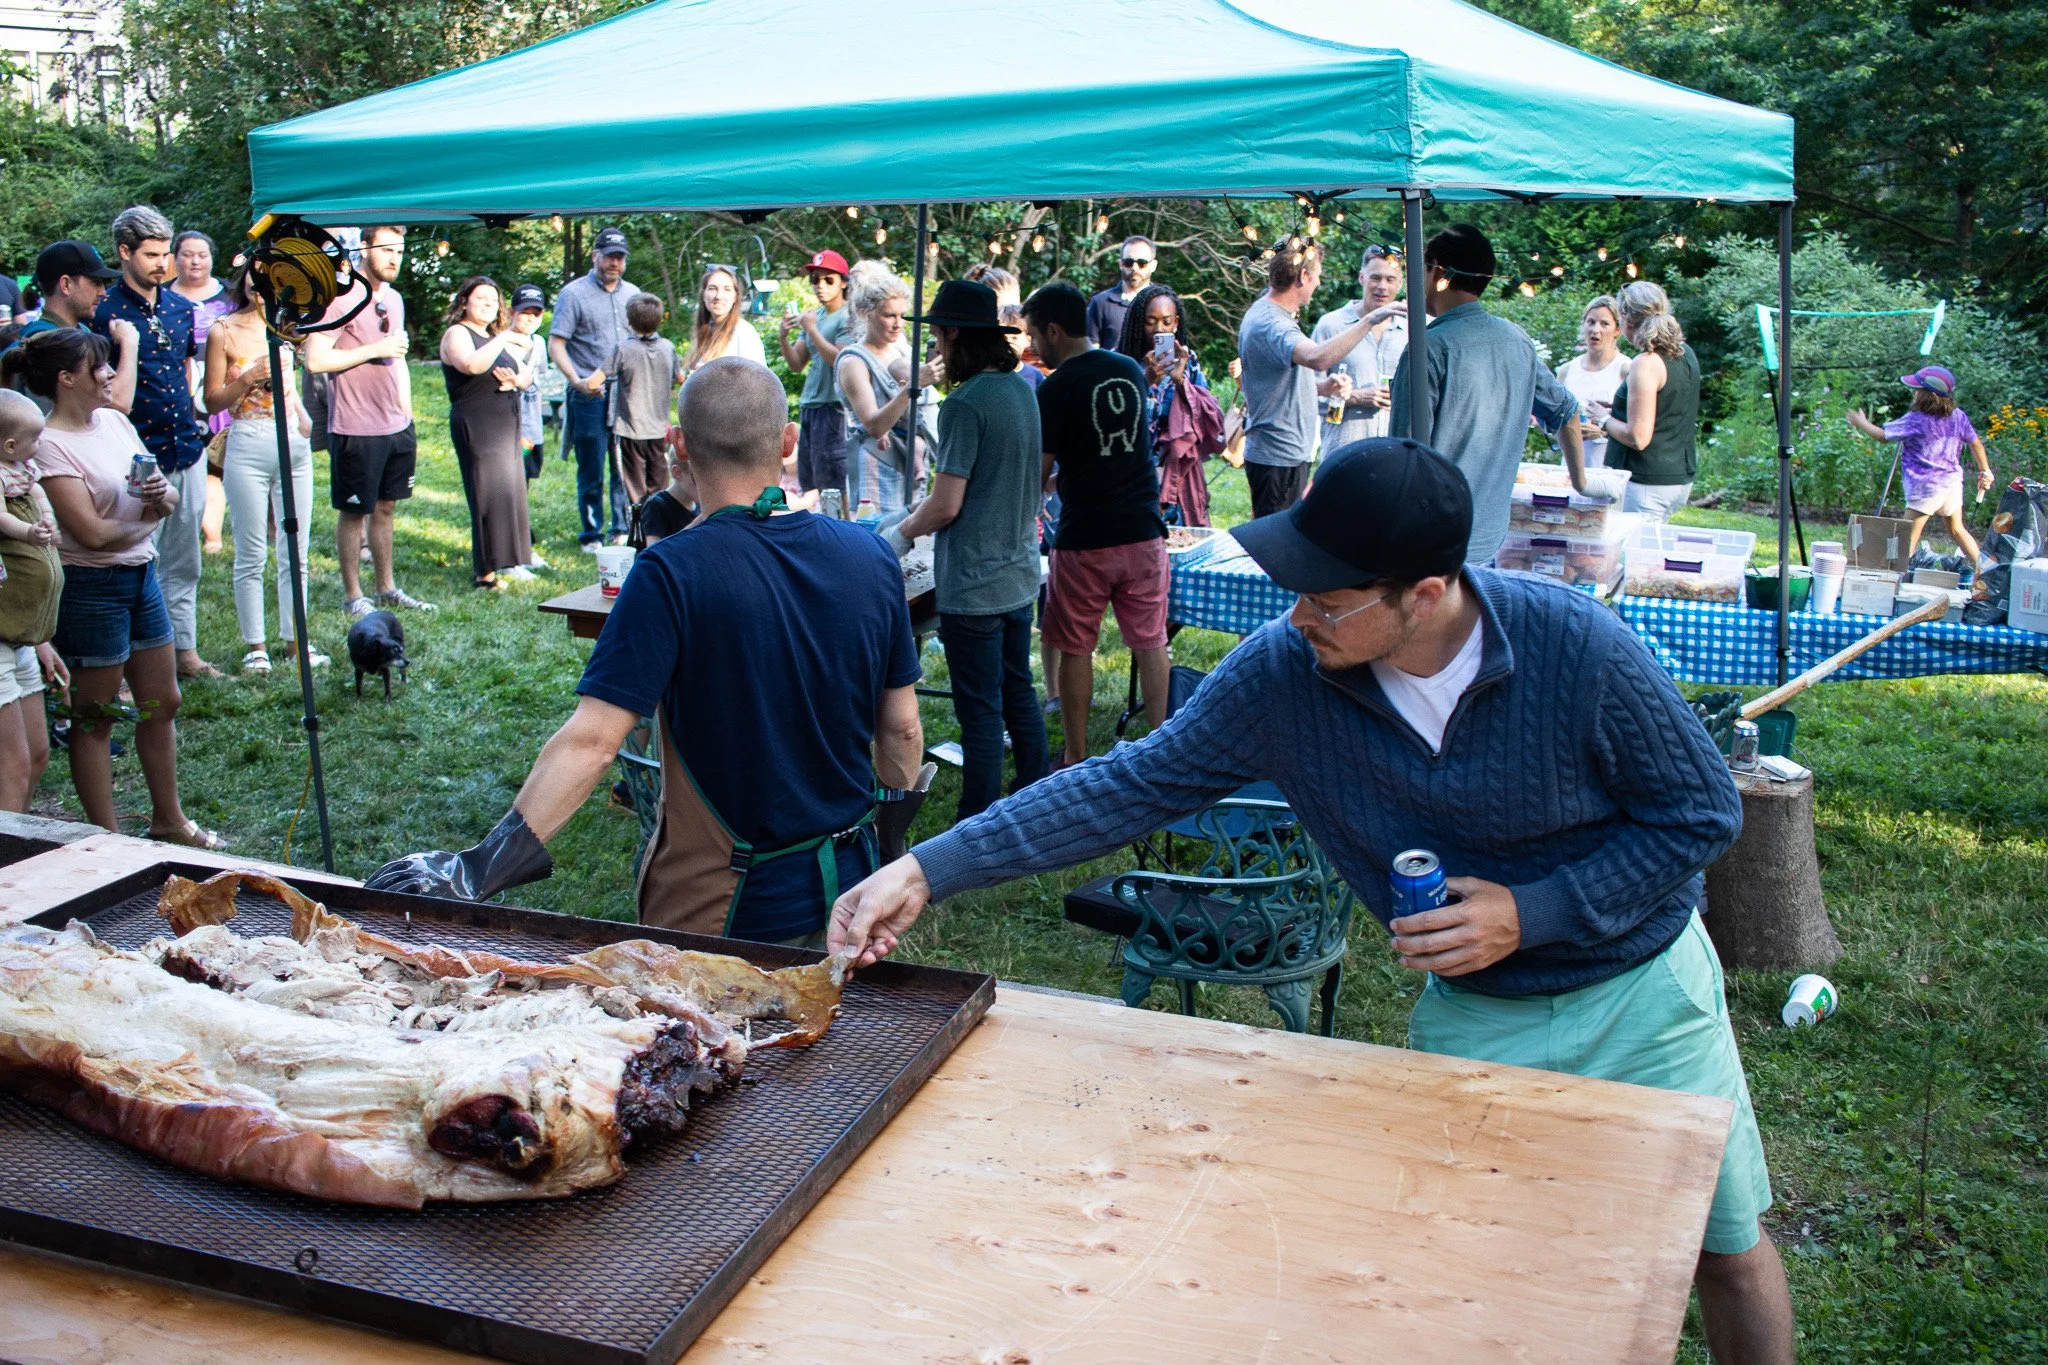
To wrap up the post, here are a few pictures from this year:


